
|
Valoración DCF de Siebert Financial Corp. (SIEB) |
Completamente Editable: Adáptelo A Sus Necesidades En Excel O Sheets
Diseño Profesional: Plantillas Confiables Y Estándares De La Industria
Predeterminadas Para Un Uso Rápido Y Eficiente
Compatible con MAC / PC, completamente desbloqueado
No Se Necesita Experiencia; Fáciles De Seguir
Siebert Financial Corp. (SIEB) Bundle
¡Explore el futuro financiero de Siebert Financial Corp. (Sieb) con nuestra calculadora DCF fácil de usar! Ingrese sus suposiciones para el crecimiento, los márgenes y los costos para determinar el valor intrínseco de Siebert Financial Corp. (Sieb) y mejorar su estrategia de inversión.
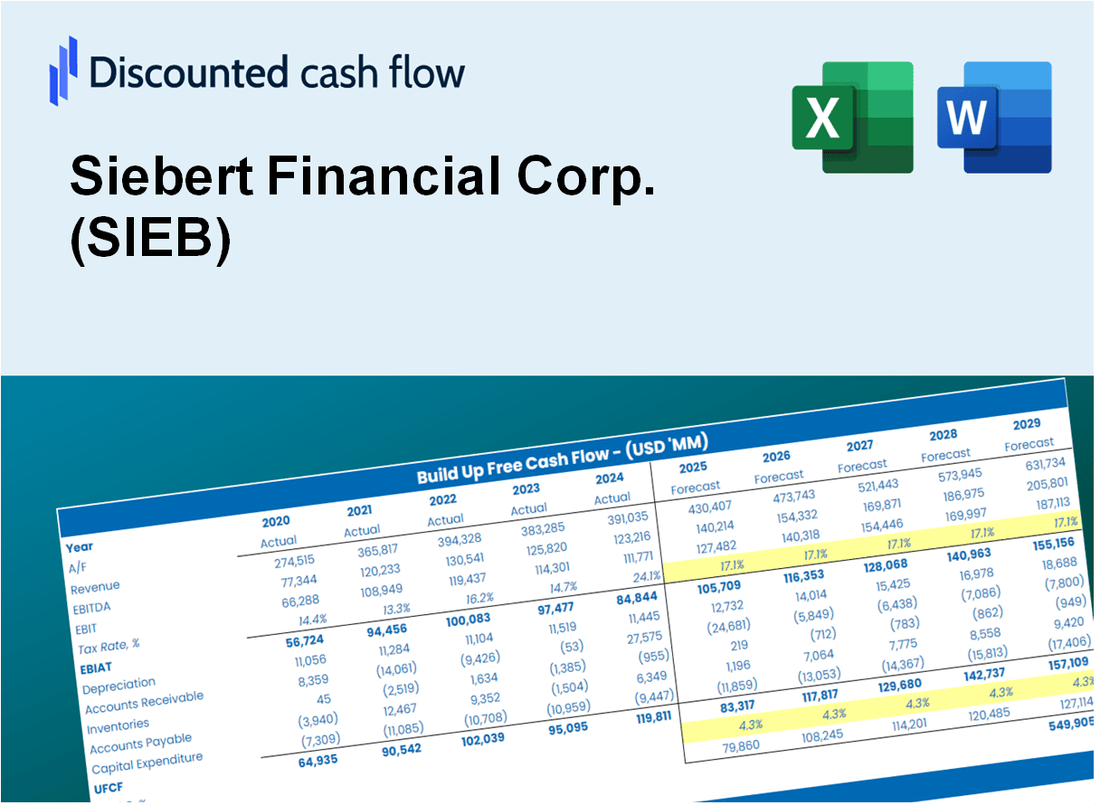
Discounted Cash Flow (DCF) - (USD MM)
| Year | AY1 2020 |
AY2 2021 |
AY3 2022 |
AY4 2023 |
AY5 2024 |
FY1 2025 |
FY2 2026 |
FY3 2027 |
FY4 2028 |
FY5 2029 |
|---|---|---|---|---|---|---|---|---|---|---|
| Revenue | 54.9 | 67.5 | 49.4 | 71.5 | 83.9 | 96.1 | 110.1 | 126.2 | 144.6 | 165.7 |
| Revenue Growth, % | 0 | 23.03 | -26.85 | 44.82 | 17.32 | 14.58 | 14.58 | 14.58 | 14.58 | 14.58 |
| EBITDA | 5.1 | 9.1 | 1.2 | 13.5 | 19.1 | 12.8 | 14.7 | 16.9 | 19.3 | 22.1 |
| EBITDA, % | 9.31 | 13.46 | 2.34 | 18.94 | 22.78 | 13.37 | 13.37 | 13.37 | 13.37 | 13.37 |
| Depreciation | 1.6 | 1.4 | 1.0 | 2.0 | 1.4 | 2.2 | 2.5 | 2.9 | 3.3 | 3.8 |
| Depreciation, % | 2.85 | 2.14 | 2.01 | 2.82 | 1.64 | 2.3 | 2.3 | 2.3 | 2.3 | 2.3 |
| EBIT | 3.5 | 7.6 | .2 | 11.5 | 17.7 | 10.6 | 12.2 | 14.0 | 16.0 | 18.3 |
| EBIT, % | 6.46 | 11.32 | 0.32602 | 16.11 | 21.13 | 11.07 | 11.07 | 11.07 | 11.07 | 11.07 |
| Total Cash | 912.0 | 947.3 | 363.8 | 418.5 | 193.0 | 96.1 | 110.1 | 126.2 | 144.6 | 165.7 |
| Total Cash, percent | .0 | .0 | .0 | .0 | .0 | .0 | .0 | .0 | .0 | .0 |
| Account Receivables | 112.9 | 95.8 | 63.4 | 79.4 | 91.6 | 96.1 | 110.1 | 126.2 | 144.6 | 165.7 |
| Account Receivables, % | 205.69 | 141.96 | 128.32 | 110.96 | 109.22 | 100 | 100 | 100 | 100 | 100 |
| Inventories | 323.6 | 325.9 | -98.9 | .0 | .0 | 19.2 | 22.0 | 25.2 | 28.9 | 33.1 |
| Inventories, % | 589.81 | 482.82 | -200.21 | 0 | 0 | 20 | 20 | 20 | 20 | 20 |
| Accounts Payable | 384.3 | 380.3 | 323.9 | 293.4 | 232.4 | 96.1 | 110.1 | 126.2 | 144.6 | 165.7 |
| Accounts Payable, % | 700.36 | 563.42 | 655.89 | 410.29 | 276.96 | 100 | 100 | 100 | 100 | 100 |
| Capital Expenditure | -.4 | -7.5 | -2.1 | -1.7 | -1.7 | -3.9 | -4.5 | -5.1 | -5.9 | -6.7 |
| Capital Expenditure, % | -0.74719 | -11.04 | -4.25 | -2.33 | -1.97 | -4.07 | -4.07 | -4.07 | -4.07 | -4.07 |
| Tax Rate, % | 23.94 | 23.94 | 23.94 | 23.94 | 23.94 | 23.94 | 23.94 | 23.94 | 23.94 | 23.94 |
| EBITAT | 3.3 | 5.7 | .1 | 8.0 | 13.5 | 7.7 | 8.8 | 10.1 | 11.5 | 13.2 |
| Depreciation | ||||||||||
| Changes in Account Receivables | ||||||||||
| Changes in Inventories | ||||||||||
| Changes in Accounts Payable | ||||||||||
| Capital Expenditure | ||||||||||
| UFCF | -47.7 | 10.5 | 399.8 | -137.0 | -60.1 | -154.0 | 4.0 | 4.6 | 5.3 | 6.1 |
| WACC, % | 7.13 | 7.09 | 7.02 | 7.08 | 7.09 | 7.08 | 7.08 | 7.08 | 7.08 | 7.08 |
| PV UFCF | ||||||||||
| SUM PV UFCF | -128.2 | |||||||||
| Long Term Growth Rate, % | 2.00 | |||||||||
| Free cash flow (T + 1) | 6 | |||||||||
| Terminal Value | 122 | |||||||||
| Present Terminal Value | 86 | |||||||||
| Enterprise Value | -42 | |||||||||
| Net Debt | -26 | |||||||||
| Equity Value | -16 | |||||||||
| Diluted Shares Outstanding, MM | 40 | |||||||||
| Equity Value Per Share | -0.41 |
What You Will Receive
- Authentic Siebert Data: Preloaded financials – encompassing revenue to EBIT – based on real and projected figures.
- Comprehensive Customization: Modify all key parameters (yellow cells) such as WACC, growth %, and tax rates.
- Immediate Valuation Adjustments: Automatic recalculations to evaluate the effects of changes on Siebert Financial Corp.'s (SIEB) fair value.
- Flexible Excel Template: Designed for quick modifications, scenario analysis, and in-depth projections.
- Efficient and Precise: Avoid building models from the ground up while ensuring accuracy and adaptability.
Key Features
- Customizable Investment Parameters: Adjust essential factors such as asset allocation, risk tolerance, and expected returns.
- Instant Portfolio Valuation: Provides real-time calculations of portfolio value, risk metrics, and performance analytics.
- Industry-Leading Precision: Incorporates Siebert Financial Corp.'s (SIEB) market insights for accurate investment assessments.
- Effortless Scenario Planning: Easily evaluate various market conditions and their potential impact on your investments.
- Efficiency-Boosting Solution: Streamline the investment analysis process without the hassle of manual calculations.
How It Works
- Download the Template: Gain immediate access to the Excel-based SIEB DCF Calculator.
- Input Your Assumptions: Modify the yellow-highlighted cells to set growth rates, WACC, margins, and additional parameters.
- Instant Calculations: The model automatically recalculates Siebert Financial Corp.’s intrinsic value.
- Test Scenarios: Experiment with various assumptions to assess potential changes in valuation.
- Analyze and Decide: Utilize the results to inform your investment or financial analysis decisions.
Why Choose Siebert Financial Corp. (SIEB)?
- Streamlined Processes: Access a comprehensive suite of financial tools without starting from scratch.
- Enhanced Accuracy: Dependable financial insights and methodologies minimize valuation errors.
- Completely Customizable: Adjust the tools to align with your unique financial strategies and forecasts.
- User-Friendly Design: Intuitive visuals and outputs facilitate straightforward analysis of results.
- Endorsed by Professionals: Crafted for experts who prioritize accuracy and functionality.
Who Should Use This Product?
- Professional Investors: Create comprehensive and trustworthy valuation models for investment analysis.
- Corporate Finance Teams: Evaluate valuation scenarios to inform strategic decision-making.
- Consultants and Advisors: Deliver precise valuation insights for Siebert Financial Corp. (SIEB) to clients.
- Students and Educators: Utilize real-world data for practicing and teaching financial modeling techniques.
- Finance Enthusiasts: Gain insights into how financial firms like Siebert Financial Corp. (SIEB) are valued in the market.
What the Template Contains
- Operating and Balance Sheet Data: Pre-filled Siebert Financial Corp. (SIEB) historical data and forecasts, including revenue, EBITDA, EBIT, and capital expenditures.
- WACC Calculation: A dedicated sheet for Weighted Average Cost of Capital (WACC), including parameters like Beta, risk-free rate, and share price.
- DCF Valuation (Unlevered and Levered): Editable Discounted Cash Flow models showing intrinsic value with detailed calculations.
- Financial Statements: Pre-loaded financial statements (annual and quarterly) to support analysis.
- Key Ratios: Includes profitability, leverage, and efficiency ratios for Siebert Financial Corp. (SIEB).
- Dashboard and Charts: Visual summary of valuation outputs and assumptions to analyze results easily.
Disclaimer
All information, articles, and product details provided on this website are for general informational and educational purposes only. We do not claim any ownership over, nor do we intend to infringe upon, any trademarks, copyrights, logos, brand names, or other intellectual property mentioned or depicted on this site. Such intellectual property remains the property of its respective owners, and any references here are made solely for identification or informational purposes, without implying any affiliation, endorsement, or partnership.
We make no representations or warranties, express or implied, regarding the accuracy, completeness, or suitability of any content or products presented. Nothing on this website should be construed as legal, tax, investment, financial, medical, or other professional advice. In addition, no part of this site—including articles or product references—constitutes a solicitation, recommendation, endorsement, advertisement, or offer to buy or sell any securities, franchises, or other financial instruments, particularly in jurisdictions where such activity would be unlawful.
All content is of a general nature and may not address the specific circumstances of any individual or entity. It is not a substitute for professional advice or services. Any actions you take based on the information provided here are strictly at your own risk. You accept full responsibility for any decisions or outcomes arising from your use of this website and agree to release us from any liability in connection with your use of, or reliance upon, the content or products found herein.