
|
Valoración DCF de Sirius XM Holdings Inc. (SIRI) |
Completamente Editable: Adáptelo A Sus Necesidades En Excel O Sheets
Diseño Profesional: Plantillas Confiables Y Estándares De La Industria
Predeterminadas Para Un Uso Rápido Y Eficiente
Compatible con MAC / PC, completamente desbloqueado
No Se Necesita Experiencia; Fáciles De Seguir
Sirius XM Holdings Inc. (SIRI) Bundle
¡Evalúe las perspectivas financieras de Sirius XM Holdings Inc. como un experto! Esta calculadora DCF (SIRI) le proporciona datos financieros precipitados y flexibilidad completa para modificar el crecimiento de los ingresos, WACC, los márgenes y otros supuestos esenciales para alinearse con sus predicciones.
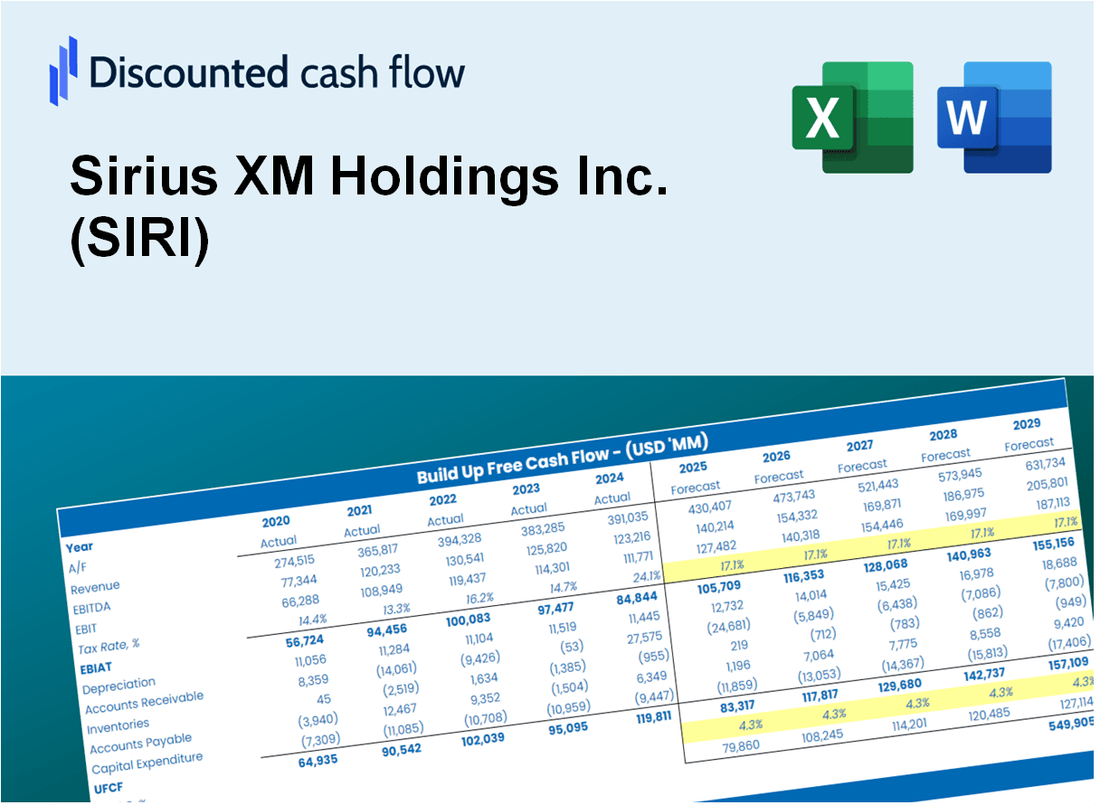
Discounted Cash Flow (DCF) - (USD MM)
| Year | AY1 2020 |
AY2 2021 |
AY3 2022 |
AY4 2023 |
AY5 2024 |
FY1 2025 |
FY2 2026 |
FY3 2027 |
FY4 2028 |
FY5 2029 |
|---|---|---|---|---|---|---|---|---|---|---|
| Revenue | 8,040.0 | 8,696.0 | 9,003.0 | 8,953.0 | 8,699.0 | 8,879.4 | 9,063.6 | 9,251.6 | 9,443.5 | 9,639.4 |
| Revenue Growth, % | 0 | 8.16 | 3.53 | -0.55537 | -2.84 | 2.07 | 2.07 | 2.07 | 2.07 | 2.07 |
| EBITDA | 1,386.0 | 2,524.0 | 2,612.0 | 2,540.0 | -747.0 | 1,688.1 | 1,723.2 | 1,758.9 | 1,795.4 | 1,832.6 |
| EBITDA, % | 17.24 | 29.02 | 29.01 | 28.37 | -8.59 | 19.01 | 19.01 | 19.01 | 19.01 | 19.01 |
| Depreciation | 562.0 | 583.0 | 585.0 | 599.0 | 622.0 | 604.4 | 616.9 | 629.7 | 642.8 | 656.1 |
| Depreciation, % | 6.99 | 6.7 | 6.5 | 6.69 | 7.15 | 6.81 | 6.81 | 6.81 | 6.81 | 6.81 |
| EBIT | 824.0 | 1,941.0 | 2,027.0 | 1,941.0 | -1,369.0 | 1,083.8 | 1,106.2 | 1,129.2 | 1,152.6 | 1,176.5 |
| EBIT, % | 10.25 | 22.32 | 22.51 | 21.68 | -15.74 | 12.21 | 12.21 | 12.21 | 12.21 | 12.21 |
| Total Cash | 71.0 | 191.0 | 57.0 | 306.0 | 162.0 | 159.7 | 163.0 | 166.4 | 169.8 | 173.4 |
| Total Cash, percent | .0 | .0 | .0 | .0 | .0 | .0 | .0 | .0 | .0 | .0 |
| Account Receivables | 672.0 | 722.0 | 655.0 | 709.0 | 676.0 | 703.7 | 718.3 | 733.2 | 748.4 | 764.0 |
| Account Receivables, % | 8.36 | 8.3 | 7.28 | 7.92 | 7.77 | 7.93 | 7.93 | 7.93 | 7.93 | 7.93 |
| Inventories | 10.0 | .0 | .0 | .0 | .0 | 2.2 | 2.3 | 2.3 | 2.3 | 2.4 |
| Inventories, % | 0.12438 | 0 | 0 | 0 | 0 | 0.02487562 | 0.02487562 | 0.02487562 | 0.02487562 | 0.02487562 |
| Accounts Payable | 1,223.0 | 1,299.0 | 1,248.0 | 1,303.0 | 1,284.0 | 1,302.2 | 1,329.2 | 1,356.8 | 1,384.9 | 1,413.6 |
| Accounts Payable, % | 15.21 | 14.94 | 13.86 | 14.55 | 14.76 | 14.67 | 14.67 | 14.67 | 14.67 | 14.67 |
| Capital Expenditure | -350.0 | -388.0 | -426.0 | -650.0 | -728.0 | -518.1 | -528.9 | -539.8 | -551.0 | -562.5 |
| Capital Expenditure, % | -4.35 | -4.46 | -4.73 | -7.26 | -8.37 | -5.84 | -5.84 | -5.84 | -5.84 | -5.84 |
| Tax Rate, % | 10.72 | 10.72 | 10.72 | 10.72 | 10.72 | 10.72 | 10.72 | 10.72 | 10.72 | 10.72 |
| EBITAT | 251.0 | 1,671.3 | 1,531.9 | 1,608.5 | -1,222.2 | 789.6 | 806.0 | 822.7 | 839.8 | 857.2 |
| Depreciation | ||||||||||
| Changes in Account Receivables | ||||||||||
| Changes in Inventories | ||||||||||
| Changes in Accounts Payable | ||||||||||
| Capital Expenditure | ||||||||||
| UFCF | 1,004.0 | 1,902.3 | 1,706.9 | 1,558.5 | -1,314.2 | 864.1 | 906.4 | 925.2 | 944.4 | 964.0 |
| WACC, % | 4.15 | 5.72 | 5.42 | 5.62 | 5.81 | 5.34 | 5.34 | 5.34 | 5.34 | 5.34 |
| PV UFCF | ||||||||||
| SUM PV UFCF | 3,938.6 | |||||||||
| Long Term Growth Rate, % | 2.00 | |||||||||
| Free cash flow (T + 1) | 983 | |||||||||
| Terminal Value | 29,415 | |||||||||
| Present Terminal Value | 22,675 | |||||||||
| Enterprise Value | 26,613 | |||||||||
| Net Debt | 10,213 | |||||||||
| Equity Value | 16,400 | |||||||||
| Diluted Shares Outstanding, MM | 338 | |||||||||
| Equity Value Per Share | 48.52 |
What You Will Receive
- Accurate SIRI Financial Data: Pre-populated with Sirius XM’s historical and projected figures for thorough analysis.
- Customizable Template: Easily adjust essential inputs such as revenue growth, WACC, and EBITDA %.
- Instant Calculations: Observe real-time updates of Sirius XM’s intrinsic value as you make changes.
- Expert Valuation Tool: Tailored for investors, analysts, and consultants aiming for precise DCF outcomes.
- Intuitive Design: User-friendly layout and straightforward instructions suitable for all skill levels.
Key Features
- Customizable Subscription Metrics: Adjust essential inputs such as subscriber growth, ARPU, and content costs.
- Instant Revenue Projections: Quickly generates forecasts for revenue, EBITDA, and other financial metrics.
- Industry-Leading Precision: Utilizes Sirius XM's actual performance data for accurate valuation results.
- Effortless Scenario Testing: Easily experiment with various assumptions and analyze different outcomes.
- Efficiency Booster: Avoid the hassle of creating intricate valuation models from the ground up.
How It Works
- Step 1: Download the Excel file.
- Step 2: Review pre-entered Sirius XM data (historical and projected).
- Step 3: Adjust key assumptions (yellow cells) based on your analysis.
- Step 4: View automatic recalculations for Sirius XM’s intrinsic value.
- Step 5: Use the outputs for investment decisions or reporting.
Why Choose This Calculator for Sirius XM Holdings Inc. (SIRI)?
- Accurate Data: Up-to-date Sirius XM financials provide dependable valuation outcomes.
- Customizable: Modify essential parameters such as growth rates, WACC, and tax rates to align with your forecasts.
- Time-Saving: Pre-configured calculations save you the hassle of building from the ground up.
- Professional-Grade Tool: Tailored for investors, analysts, and consultants focused on Sirius XM.
- User-Friendly: Easy-to-navigate design and clear instructions ensure accessibility for all users.
Who Should Use This Product?
- Investors: Assess Sirius XM's valuation prior to making stock transactions.
- CFOs and Financial Analysts: Optimize valuation workflows and evaluate financial forecasts.
- Startup Founders: Understand the valuation methods applied to leading companies like Sirius XM.
- Consultants: Create detailed valuation reports for your clients.
- Students and Educators: Utilize current data to learn and teach valuation strategies.
What the Template Contains
- Pre-Filled DCF Model: Sirius XM Holdings Inc.’s (SIRI) financial data preloaded for immediate use.
- WACC Calculator: Detailed calculations for Weighted Average Cost of Capital.
- Financial Ratios: Evaluate Sirius XM’s (SIRI) profitability, leverage, and efficiency.
- Editable Inputs: Change assumptions such as growth, margins, and CAPEX to fit your scenarios.
- Financial Statements: Annual and quarterly reports to support detailed analysis.
- Interactive Dashboard: Easily visualize key valuation metrics and results.
Disclaimer
All information, articles, and product details provided on this website are for general informational and educational purposes only. We do not claim any ownership over, nor do we intend to infringe upon, any trademarks, copyrights, logos, brand names, or other intellectual property mentioned or depicted on this site. Such intellectual property remains the property of its respective owners, and any references here are made solely for identification or informational purposes, without implying any affiliation, endorsement, or partnership.
We make no representations or warranties, express or implied, regarding the accuracy, completeness, or suitability of any content or products presented. Nothing on this website should be construed as legal, tax, investment, financial, medical, or other professional advice. In addition, no part of this site—including articles or product references—constitutes a solicitation, recommendation, endorsement, advertisement, or offer to buy or sell any securities, franchises, or other financial instruments, particularly in jurisdictions where such activity would be unlawful.
All content is of a general nature and may not address the specific circumstances of any individual or entity. It is not a substitute for professional advice or services. Any actions you take based on the information provided here are strictly at your own risk. You accept full responsibility for any decisions or outcomes arising from your use of this website and agree to release us from any liability in connection with your use of, or reliance upon, the content or products found herein.