
|
La valoración DCF de la empresa J. M. Smucker (SJM) |
Completamente Editable: Adáptelo A Sus Necesidades En Excel O Sheets
Diseño Profesional: Plantillas Confiables Y Estándares De La Industria
Predeterminadas Para Un Uso Rápido Y Eficiente
Compatible con MAC / PC, completamente desbloqueado
No Se Necesita Experiencia; Fáciles De Seguir
The J. M. Smucker Company (SJM) Bundle
¡Obtenga información sobre su análisis de valoración de J. M. Smucker Company (SJM) con nuestra calculadora DCF de vanguardia! Precedido con datos reales (SJM), esta plantilla de Excel le permite ajustar los pronósticos y supuestos para determinar con precisión el valor intrínseco de J. M. Smucker Company.
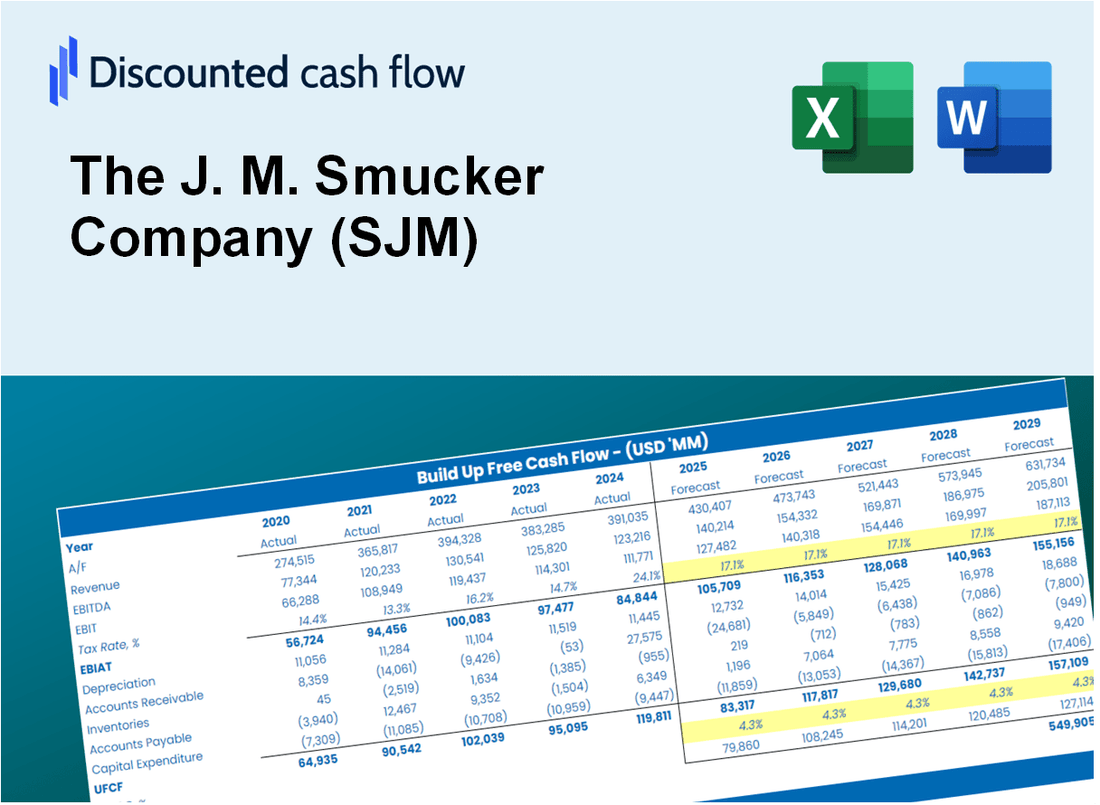
Discounted Cash Flow (DCF) - (USD MM)
| Year | AY1 2021 |
AY2 2022 |
AY3 2023 |
AY4 2024 |
AY5 2025 |
FY1 2026 |
FY2 2027 |
FY3 2028 |
FY4 2029 |
FY5 2030 |
|---|---|---|---|---|---|---|---|---|---|---|
| Revenue | 8,002.7 | 7,998.9 | 8,529.2 | 8,178.7 | 8,726.1 | 8,926.1 | 9,130.6 | 9,339.8 | 9,553.8 | 9,772.7 |
| Revenue Growth, % | 0 | -0.04748397 | 6.63 | -4.11 | 6.69 | 2.29 | 2.29 | 2.29 | 2.29 | 2.29 |
| EBITDA | 1,801.5 | 1,463.8 | 573.8 | 1,691.5 | -155.6 | 1,186.0 | 1,213.2 | 1,241.0 | 1,269.5 | 1,298.5 |
| EBITDA, % | 22.51 | 18.3 | 6.73 | 20.68 | -1.78 | 13.29 | 13.29 | 13.29 | 13.29 | 13.29 |
| Depreciation | 452.5 | 459.1 | 431.0 | 430.8 | 502.5 | 490.5 | 501.7 | 513.2 | 524.9 | 537.0 |
| Depreciation, % | 5.65 | 5.74 | 5.05 | 5.27 | 5.76 | 5.49 | 5.49 | 5.49 | 5.49 | 5.49 |
| EBIT | 1,349.0 | 1,004.7 | 142.8 | 1,260.7 | -658.1 | 695.6 | 711.5 | 727.8 | 744.5 | 761.6 |
| EBIT, % | 16.86 | 12.56 | 1.67 | 15.41 | -7.54 | 7.79 | 7.79 | 7.79 | 7.79 | 7.79 |
| Total Cash | 334.3 | 169.9 | 1,143.6 | 62.0 | 69.9 | 379.7 | 388.4 | 397.3 | 406.4 | 415.7 |
| Total Cash, percent | .0 | .0 | .0 | .0 | .0 | .0 | .0 | .0 | .0 | .0 |
| Account Receivables | 533.7 | 524.7 | 597.6 | 736.5 | 619.0 | 648.6 | 663.5 | 678.7 | 694.3 | 710.2 |
| Account Receivables, % | 6.67 | 6.56 | 7.01 | 9.01 | 7.09 | 7.27 | 7.27 | 7.27 | 7.27 | 7.27 |
| Inventories | 959.9 | 1,089.3 | 1,009.8 | 1,038.9 | 1,209.4 | 1,142.8 | 1,169.0 | 1,195.8 | 1,223.2 | 1,251.2 |
| Inventories, % | 11.99 | 13.62 | 11.84 | 12.7 | 13.86 | 12.8 | 12.8 | 12.8 | 12.8 | 12.8 |
| Accounts Payable | 1,034.1 | 1,193.3 | 1,392.6 | 1,336.2 | 1,288.7 | 1,343.8 | 1,374.6 | 1,406.1 | 1,438.3 | 1,471.3 |
| Accounts Payable, % | 12.92 | 14.92 | 16.33 | 16.34 | 14.77 | 15.05 | 15.05 | 15.05 | 15.05 | 15.05 |
| Capital Expenditure | -306.7 | -417.5 | -471.0 | -586.5 | -393.8 | -468.8 | -479.5 | -490.5 | -501.7 | -513.2 |
| Capital Expenditure, % | -3.83 | -5.22 | -5.52 | -7.17 | -4.51 | -5.25 | -5.25 | -5.25 | -5.25 | -5.25 |
| Tax Rate, % | -17.58 | -17.58 | -17.58 | -17.58 | -17.58 | -17.58 | -17.58 | -17.58 | -17.58 | -17.58 |
| EBITAT | 1,008.7 | 752.2 | 1,417.1 | 941.3 | -773.8 | 590.3 | 603.8 | 617.7 | 631.8 | 646.3 |
| Depreciation | ||||||||||
| Changes in Account Receivables | ||||||||||
| Changes in Inventories | ||||||||||
| Changes in Accounts Payable | ||||||||||
| Capital Expenditure | ||||||||||
| UFCF | 695.0 | 832.6 | 1,583.0 | 561.2 | -765.6 | 704.0 | 615.7 | 629.9 | 644.3 | 659.1 |
| WACC, % | 4.29 | 4.29 | 4.76 | 4.29 | 4.76 | 4.48 | 4.48 | 4.48 | 4.48 | 4.48 |
| PV UFCF | ||||||||||
| SUM PV UFCF | 2,860.3 | |||||||||
| Long Term Growth Rate, % | 2.00 | |||||||||
| Free cash flow (T + 1) | 672 | |||||||||
| Terminal Value | 27,112 | |||||||||
| Present Terminal Value | 21,778 | |||||||||
| Enterprise Value | 24,638 | |||||||||
| Net Debt | 7,692 | |||||||||
| Equity Value | 16,946 | |||||||||
| Diluted Shares Outstanding, MM | 106 | |||||||||
| Equity Value Per Share | 159.27 |
What You Will Receive
- Customizable Excel Template: A fully editable Excel-based DCF Calculator featuring pre-filled real financial data for The J. M. Smucker Company (SJM).
- Accurate Historical Data: Access to past performance data and forward-looking projections (highlighted in the designated cells).
- Flexible Forecasting: Adjust key assumptions such as revenue growth, EBITDA margin, and WACC as needed.
- Instant Calculations: Quickly observe how your inputs affect the valuation of The J. M. Smucker Company (SJM).
- Professional Resource: Designed for investors, CFOs, consultants, and financial analysts.
- Intuitive Layout: Organized for simplicity and ease of navigation, complete with step-by-step guidance.
Key Features
- Comprehensive DCF Calculator: Features detailed unlevered and levered DCF valuation models tailored for The J. M. Smucker Company (SJM).
- WACC Calculator: Comes with a pre-built Weighted Average Cost of Capital sheet that allows for customizable inputs specific to SJM.
- Adjustable Forecast Assumptions: Easily modify growth rates, capital expenditures, and discount rates to fit SJM's financial outlook.
- Integrated Financial Ratios: Evaluate profitability, leverage, and efficiency ratios relevant to The J. M. Smucker Company (SJM).
- Interactive Dashboard and Charts: Visual representations that summarize essential valuation metrics for straightforward analysis of SJM.
How It Works
- Download: Obtain the pre-formatted Excel file featuring The J. M. Smucker Company’s (SJM) financial data.
- Customize: Modify forecasts such as revenue growth, EBITDA %, and WACC to suit your analysis.
- Update Automatically: The intrinsic value and NPV calculations refresh in real-time as you make changes.
- Test Scenarios: Develop various projections and instantly compare the results.
- Make Decisions: Leverage the valuation insights to inform your investment decisions.
Why Choose This Calculator for The J. M. Smucker Company (SJM)?
- Accurate Data: Real J. M. Smucker financials provide trustworthy valuation outcomes.
- Customizable: Tailor key metrics such as growth rates, WACC, and tax rates to fit your forecasts.
- Time-Saving: Pre-configured calculations save you from starting from the ground up.
- Professional-Grade Tool: Crafted for investors, analysts, and consultants in the food industry.
- User-Friendly: Easy-to-navigate interface and step-by-step guidance make it accessible for everyone.
Who Should Use This Product?
- Professional Investors: Develop comprehensive and accurate valuation models for portfolio assessments related to The J. M. Smucker Company (SJM).
- Corporate Finance Teams: Evaluate valuation scenarios to inform strategic decisions within their organizations.
- Consultants and Advisors: Deliver precise valuation insights for clients interested in The J. M. Smucker Company (SJM).
- Students and Educators: Utilize real-world data to enhance learning in financial modeling and analysis.
- Food Industry Analysts: Gain insights into how companies like The J. M. Smucker Company (SJM) are valued in the competitive market.
What the Template Contains
- Pre-Filled Data: Includes The J. M. Smucker Company's historical financials and forecasts.
- Discounted Cash Flow Model: Editable DCF valuation model with automatic calculations.
- Weighted Average Cost of Capital (WACC): A dedicated sheet for calculating WACC based on custom inputs.
- Key Financial Ratios: Analyze The J. M. Smucker Company's profitability, efficiency, and leverage.
- Customizable Inputs: Edit revenue growth, margins, and tax rates with ease.
- Clear Dashboard: Charts and tables summarizing key valuation results.
Disclaimer
All information, articles, and product details provided on this website are for general informational and educational purposes only. We do not claim any ownership over, nor do we intend to infringe upon, any trademarks, copyrights, logos, brand names, or other intellectual property mentioned or depicted on this site. Such intellectual property remains the property of its respective owners, and any references here are made solely for identification or informational purposes, without implying any affiliation, endorsement, or partnership.
We make no representations or warranties, express or implied, regarding the accuracy, completeness, or suitability of any content or products presented. Nothing on this website should be construed as legal, tax, investment, financial, medical, or other professional advice. In addition, no part of this site—including articles or product references—constitutes a solicitation, recommendation, endorsement, advertisement, or offer to buy or sell any securities, franchises, or other financial instruments, particularly in jurisdictions where such activity would be unlawful.
All content is of a general nature and may not address the specific circumstances of any individual or entity. It is not a substitute for professional advice or services. Any actions you take based on the information provided here are strictly at your own risk. You accept full responsibility for any decisions or outcomes arising from your use of this website and agree to release us from any liability in connection with your use of, or reliance upon, the content or products found herein.