
|
Skyward Specialty Insurance Group, Inc. (SKWD) Valoración de DCF |
Completamente Editable: Adáptelo A Sus Necesidades En Excel O Sheets
Diseño Profesional: Plantillas Confiables Y Estándares De La Industria
Predeterminadas Para Un Uso Rápido Y Eficiente
Compatible con MAC / PC, completamente desbloqueado
No Se Necesita Experiencia; Fáciles De Seguir
Skyward Specialty Insurance Group, Inc. (SKWD) Bundle
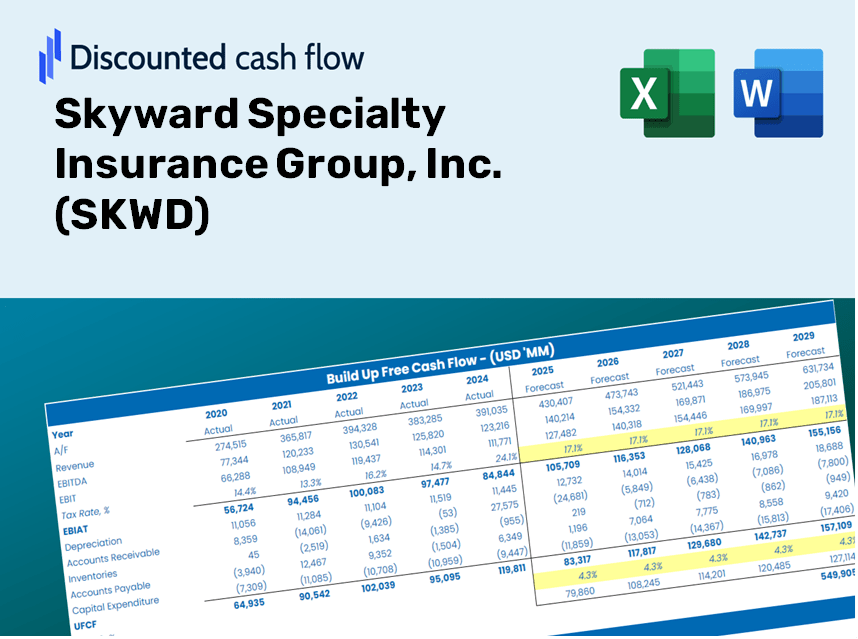
¡Mejore su estrategia de inversión con la calculadora DCF (SKWD)! Revise los datos financieros genuinos para el grupo de seguros especializados de Skyward, ajuste las predicciones y gastos de crecimiento, y observe instantáneamente cómo estas modificaciones afectan el valor intrínseco de (SKWD).
Discounted Cash Flow (DCF) - (USD MM)
| Year | AY1 2020 |
AY2 2021 |
AY3 2022 |
AY4 2023 |
AY5 2024 |
FY1 2025 |
FY2 2026 |
FY3 2027 |
FY4 2028 |
FY5 2029 |
|---|---|---|---|---|---|---|---|---|---|---|
| Revenue | 447.9 | 535.8 | 636.4 | 895.4 | 1,147.7 | 1,455.5 | 1,845.8 | 2,340.8 | 2,968.6 | 3,764.8 |
| Revenue Growth, % | 0 | 19.63 | 18.77 | 40.7 | 28.17 | 26.82 | 26.82 | 26.82 | 26.82 | 26.82 |
| EBITDA | -83.0 | 58.5 | 60.3 | 124.0 | 165.6 | 87.7 | 111.3 | 141.1 | 179.0 | 227.0 |
| EBITDA, % | -18.53 | 10.92 | 9.47 | 13.85 | 14.43 | 6.03 | 6.03 | 6.03 | 6.03 | 6.03 |
| Depreciation | 6.0 | 5.6 | 4.1 | 3.9 | 3.4 | 10.9 | 13.9 | 17.6 | 22.3 | 28.3 |
| Depreciation, % | 1.34 | 1.05 | 0.64377 | 0.43455 | 0.29259 | 0.75057 | 0.75057 | 0.75057 | 0.75057 | 0.75057 |
| EBIT | -89.0 | 52.9 | 56.2 | 120.1 | 162.2 | 76.8 | 97.4 | 123.5 | 156.7 | 198.7 |
| EBIT, % | -19.87 | 9.88 | 8.83 | 13.42 | 14.14 | 5.28 | 5.28 | 5.28 | 5.28 | 5.28 |
| Total Cash | 299.4 | 664.7 | 774.2 | 863.9 | 1,175.2 | 1,348.7 | 1,710.5 | 2,169.2 | 2,750.9 | 3,488.7 |
| Total Cash, percent | .0 | .0 | .0 | .0 | .0 | .0 | .0 | .0 | .0 | .0 |
| Account Receivables | .0 | 648.5 | 720.6 | 775.6 | 1,179.5 | 1,125.4 | 1,427.2 | 1,810.0 | 2,295.4 | 2,911.1 |
| Account Receivables, % | 0 | 121.03 | 113.23 | 86.62 | 102.77 | 77.32 | 77.32 | 77.32 | 77.32 | 77.32 |
| Inventories | .0 | .0 | .0 | .0 | .0 | .0 | .0 | .0 | .0 | .0 |
| Inventories, % | 0 | 0 | 0 | 0 | 0 | 0 | 0 | 0 | 0 | 0 |
| Accounts Payable | 164.3 | 160.7 | 162.2 | 201.0 | 253.3 | 397.9 | 504.6 | 639.9 | 811.6 | 1,029.2 |
| Accounts Payable, % | 36.69 | 29.99 | 25.49 | 22.45 | 22.07 | 27.34 | 27.34 | 27.34 | 27.34 | 27.34 |
| Capital Expenditure | -2.1 | -2.2 | -2.3 | -3.2 | -4.2 | -5.7 | -7.2 | -9.1 | -11.6 | -14.7 |
| Capital Expenditure, % | -0.46262 | -0.402 | -0.36533 | -0.35269 | -0.36805 | -0.39014 | -0.39014 | -0.39014 | -0.39014 | -0.39014 |
| Tax Rate, % | 22.2 | 22.2 | 22.2 | 22.2 | 22.2 | 22.2 | 22.2 | 22.2 | 22.2 | 22.2 |
| EBITAT | -70.3 | 42.0 | 44.5 | 93.8 | 126.2 | 60.4 | 76.6 | 97.2 | 123.2 | 156.3 |
| Depreciation | ||||||||||
| Changes in Account Receivables | ||||||||||
| Changes in Inventories | ||||||||||
| Changes in Accounts Payable | ||||||||||
| Capital Expenditure | ||||||||||
| UFCF | 98.0 | -606.7 | -24.3 | 78.4 | -226.4 | 264.4 | -111.8 | -141.8 | -179.9 | -228.1 |
| WACC, % | 6.37 | 6.37 | 6.37 | 6.37 | 6.37 | 6.37 | 6.37 | 6.37 | 6.37 | 6.37 |
| PV UFCF | ||||||||||
| SUM PV UFCF | -276.1 | |||||||||
| Long Term Growth Rate, % | 2.00 | |||||||||
| Free cash flow (T + 1) | -233 | |||||||||
| Terminal Value | -5,323 | |||||||||
| Present Terminal Value | -3,908 | |||||||||
| Enterprise Value | -4,185 | |||||||||
| Net Debt | -2 | |||||||||
| Equity Value | -4,183 | |||||||||
| Diluted Shares Outstanding, MM | 41 | |||||||||
| Equity Value Per Share | -101.08 |
Benefits You Will Receive
- Comprehensive SKWD Financials: Access to both historical data and future projections for precise valuation.
- Customizable Variables: Adjust metrics such as WACC, tax rates, premium growth, and operational expenditures.
- Real-Time Calculations: Intrinsic value and NPV are updated automatically.
- Scenario Simulations: Analyze various scenarios to assess the future trajectories of Skyward Specialty Insurance.
- User-Friendly Interface: Designed for industry professionals while remaining easy for newcomers to navigate.
Key Features of Skyward Specialty Insurance Group, Inc. (SKWD)
- Customizable Risk Assessment Parameters: Adjust key metrics such as underwriting performance, loss ratios, and expense ratios.
- Instant Premium Valuation: Provides quick calculations of necessary premiums, reserve estimates, and more.
- High Precision Analysis: Relies on Skyward’s current financial data for dependable valuation results.
- Streamlined Scenario Testing: Easily evaluate different scenarios and analyze their impacts on the business.
- Efficiency Booster: Save time by avoiding the complexities of creating intricate valuation models from the ground up.
How It Operates
- Download the Template: Gain immediate access to the Excel-based SKWD Valuation Calculator.
- Input Your Assumptions: Modify the yellow-highlighted cells to customize growth rates, WACC, profit margins, and other factors.
- Instant Calculations: The model will automatically refresh to display the intrinsic value of Skyward Specialty Insurance Group, Inc. (SKWD).
- Test Scenarios: Experiment with various assumptions to assess potential changes in valuation.
- Analyze and Decide: Leverage the outcomes to inform your investment strategies or financial assessments.
Why Opt for This Insurance Calculator?
- Precision: Utilizes authentic Skyward Specialty Insurance Group, Inc. (SKWD) data for reliable insights.
- Adaptability: Engineered for users to easily experiment with and adjust their parameters.
- Efficiency: Eliminate the need for manual calculations by using our ready-to-go tool.
- Expert-Level: Crafted with the attention to detail suited for insurance professionals.
- Intuitive: Simple to navigate, making it accessible for users at all experience levels.
Who Can Benefit from Our Services?
- Insurance Students: Understand underwriting practices and apply them with real-world case studies.
- Researchers: Utilize advanced models in your studies or scholarly work.
- Investors: Evaluate your investment strategies and assess the performance of Skyward Specialty Insurance Group (SKWD).
- Analysts: Enhance your efficiency with our customizable insurance analysis tools.
- Small Business Owners: Discover how large insurance firms like Skyward Specialty are evaluated and managed.
What the Template Contains
- Historical Data: Contains the past financial performance and baseline forecasts for Skyward Specialty Insurance Group, Inc. (SKWD).
- DCF and Levered DCF Models: Comprehensive templates for calculating the intrinsic value of Skyward Specialty Insurance Group, Inc. (SKWD).
- WACC Sheet: Pre-calculated metrics for the Weighted Average Cost of Capital tailored for Skyward Specialty Insurance Group, Inc. (SKWD).
- Editable Inputs: Adjust critical drivers such as growth projections, EBITDA percentages, and CAPEX assumptions.
- Quarterly and Annual Statements: A thorough analysis of Skyward Specialty Insurance Group, Inc. (SKWD)'s financial data.
- Interactive Dashboard: A dynamic interface to visualize valuation outcomes and forecasts.
Disclaimer
All information, articles, and product details provided on this website are for general informational and educational purposes only. We do not claim any ownership over, nor do we intend to infringe upon, any trademarks, copyrights, logos, brand names, or other intellectual property mentioned or depicted on this site. Such intellectual property remains the property of its respective owners, and any references here are made solely for identification or informational purposes, without implying any affiliation, endorsement, or partnership.
We make no representations or warranties, express or implied, regarding the accuracy, completeness, or suitability of any content or products presented. Nothing on this website should be construed as legal, tax, investment, financial, medical, or other professional advice. In addition, no part of this site—including articles or product references—constitutes a solicitation, recommendation, endorsement, advertisement, or offer to buy or sell any securities, franchises, or other financial instruments, particularly in jurisdictions where such activity would be unlawful.
All content is of a general nature and may not address the specific circumstances of any individual or entity. It is not a substitute for professional advice or services. Any actions you take based on the information provided here are strictly at your own risk. You accept full responsibility for any decisions or outcomes arising from your use of this website and agree to release us from any liability in connection with your use of, or reliance upon, the content or products found herein.