
|
Valoración DCF de SLM Corporation (SLM) |
Completamente Editable: Adáptelo A Sus Necesidades En Excel O Sheets
Diseño Profesional: Plantillas Confiables Y Estándares De La Industria
Predeterminadas Para Un Uso Rápido Y Eficiente
Compatible con MAC / PC, completamente desbloqueado
No Se Necesita Experiencia; Fáciles De Seguir
SLM Corporation (SLM) Bundle
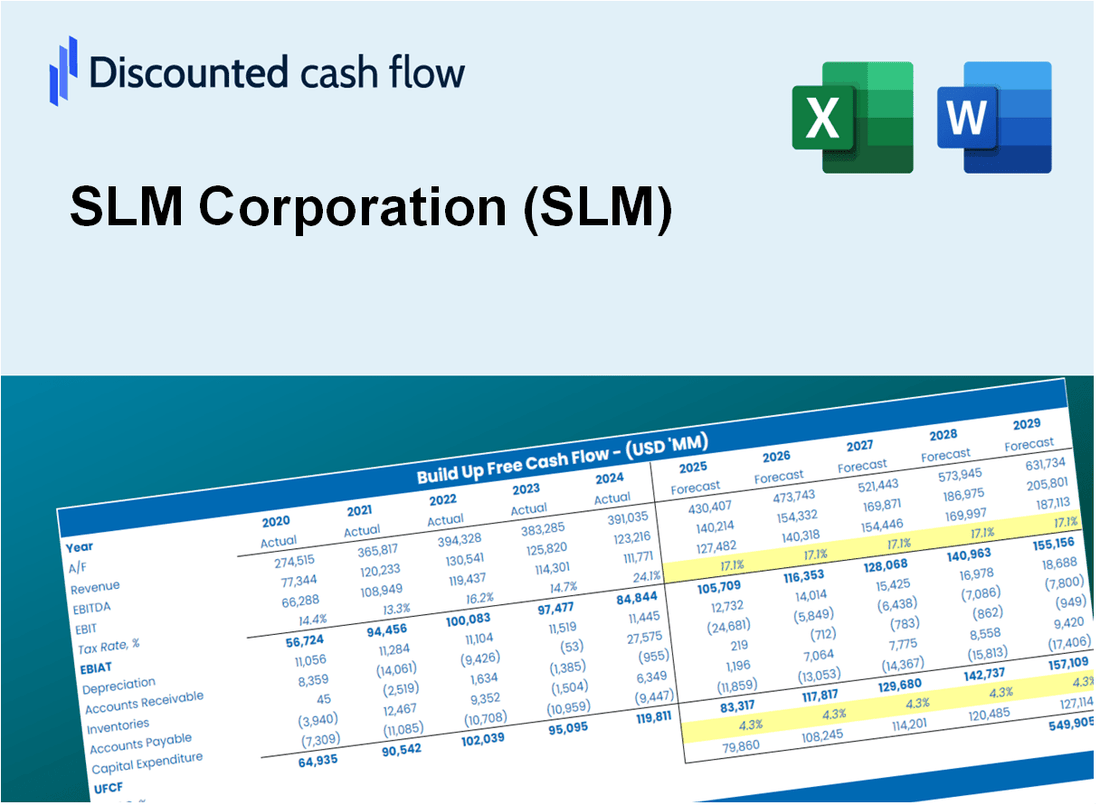
¡Agilice su análisis y mejore la precisión con nuestra calculadora SLM DCF! Equipado con datos reales de SLM Corporation y supuestos personalizables, esta herramienta le permite pronosticar, analizar y valorar SLM (SLM) como un inversor experimentado.
What You Will Get
- Editable Forecast Inputs: Seamlessly adjust assumptions (growth %, margins, WACC) to explore various scenarios.
- Real-World Data: SLM Corporation’s financial data pre-loaded to enhance your analysis.
- Automatic DCF Outputs: The template computes Net Present Value (NPV) and intrinsic value automatically.
- Customizable and Professional: A refined Excel model that tailors to your valuation requirements.
- Built for Analysts and Investors: Perfect for evaluating projections, confirming strategies, and optimizing efficiency.
Key Features
- Comprehensive SLM Financials: Gain access to precise pre-loaded historical data and future forecasts for SLM Corporation (SLM).
- Adjustable Forecast Parameters: Modify highlighted cells such as WACC, growth rates, and profit margins to fit your analysis.
- Real-Time Calculations: Experience automatic updates for DCF, Net Present Value (NPV), and cash flow evaluations.
- User-Friendly Dashboard: View straightforward charts and summaries to effectively interpret your valuation outcomes.
- Designed for All Skill Levels: An intuitive layout tailored for investors, CFOs, and consultants alike.
How It Works
- Step 1: Download the Excel file.
- Step 2: Review pre-entered SLM Corporation (SLM) data (historical and projected).
- Step 3: Adjust key assumptions (yellow cells) based on your analysis.
- Step 4: View automatic recalculations for SLM Corporation’s intrinsic value.
- Step 5: Use the outputs for investment decisions or reporting.
Why Choose This Calculator for SLM Corporation (SLM)?
- Designed for Experts: A sophisticated tool tailored for analysts, CFOs, and financial consultants.
- Accurate Financial Data: SLM Corporation’s historical and projected financials are preloaded for precision.
- Flexible Scenario Analysis: Effortlessly simulate various forecasts and assumptions.
- Comprehensive Outputs: Automatically computes intrinsic value, NPV, and essential metrics.
- User-Friendly Interface: Step-by-step guidance takes you through each stage of the process.
Who Should Use SLM Corporation (SLM)?
- Finance Students: Explore financial modeling techniques and apply them with real-world data.
- Academics: Integrate industry-standard models into your research or teaching materials.
- Investors: Validate your investment strategies and evaluate valuation scenarios for SLM Corporation (SLM).
- Analysts: Enhance your analysis process with a user-friendly, customizable DCF model.
- Small Business Owners: Understand how large corporations like SLM Corporation (SLM) are evaluated in the market.
What the Template Contains
- Comprehensive DCF Model: Editable template with detailed valuation calculations tailored for SLM Corporation (SLM).
- Real-World Data: SLM Corporation’s historical and projected financials preloaded for analysis.
- Customizable Parameters: Adjust WACC, growth rates, and tax assumptions to explore various scenarios.
- Financial Statements: Complete annual and quarterly breakdowns for enhanced insights into SLM Corporation (SLM).
- Key Ratios: Built-in analysis for profitability, efficiency, and leverage specific to SLM Corporation (SLM).
- Dashboard with Visual Outputs: Charts and tables for clear, actionable results focused on SLM Corporation (SLM).
Disclaimer
All information, articles, and product details provided on this website are for general informational and educational purposes only. We do not claim any ownership over, nor do we intend to infringe upon, any trademarks, copyrights, logos, brand names, or other intellectual property mentioned or depicted on this site. Such intellectual property remains the property of its respective owners, and any references here are made solely for identification or informational purposes, without implying any affiliation, endorsement, or partnership.
We make no representations or warranties, express or implied, regarding the accuracy, completeness, or suitability of any content or products presented. Nothing on this website should be construed as legal, tax, investment, financial, medical, or other professional advice. In addition, no part of this site—including articles or product references—constitutes a solicitation, recommendation, endorsement, advertisement, or offer to buy or sell any securities, franchises, or other financial instruments, particularly in jurisdictions where such activity would be unlawful.
All content is of a general nature and may not address the specific circumstances of any individual or entity. It is not a substitute for professional advice or services. Any actions you take based on the information provided here are strictly at your own risk. You accept full responsibility for any decisions or outcomes arising from your use of this website and agree to release us from any liability in connection with your use of, or reliance upon, the content or products found herein.