
|
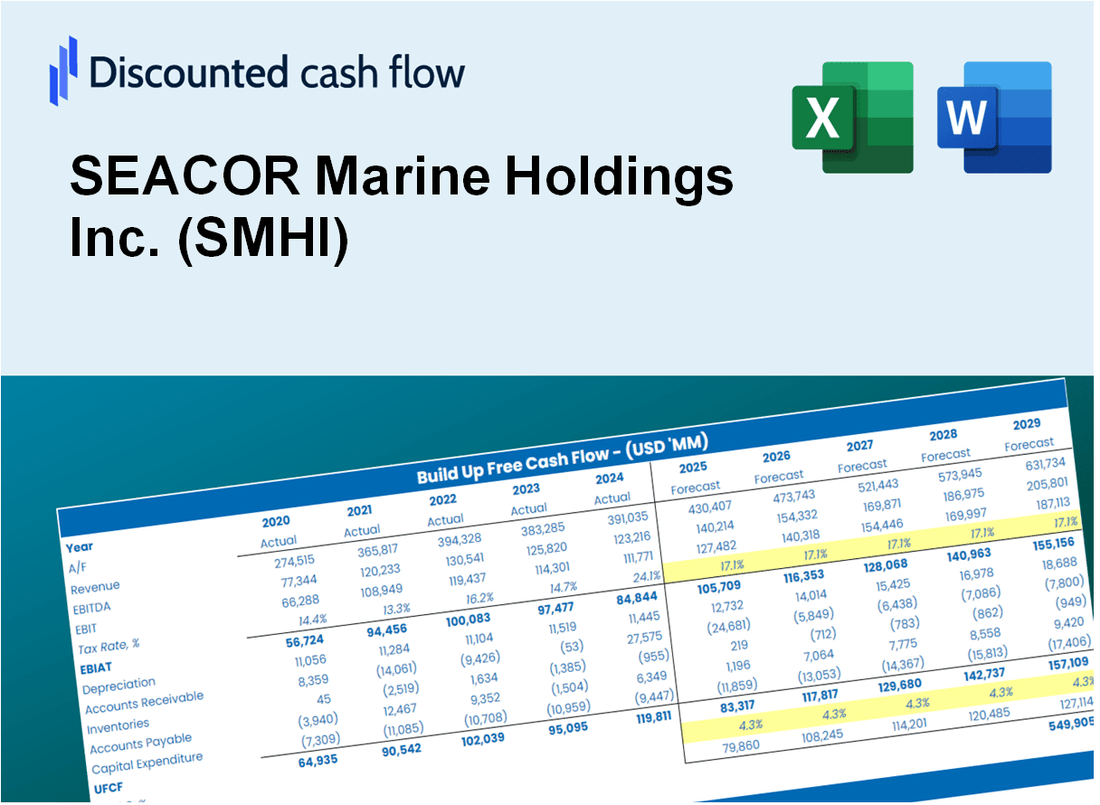
Valoración DCF de SEACOR Marine Holdings Inc. (SMHI) |
Completamente Editable: Adáptelo A Sus Necesidades En Excel O Sheets
Diseño Profesional: Plantillas Confiables Y Estándares De La Industria
Predeterminadas Para Un Uso Rápido Y Eficiente
Compatible con MAC / PC, completamente desbloqueado
No Se Necesita Experiencia; Fáciles De Seguir
SEACOR Marine Holdings Inc. (SMHI) Bundle
Ya sea que sea un inversor o analista, esta calculadora DCF de Seaacor Marine Holdings Inc. (SMHI) es su herramienta de referencia para una valoración precisa. Precedidos con datos reales de Seacor Marine, puede ajustar los pronósticos y observar instantáneamente los efectos.
Discounted Cash Flow (DCF) - (USD MM)
| Year | AY1 2020 |
AY2 2021 |
AY3 2022 |
AY4 2023 |
AY5 2024 |
FY1 2025 |
FY2 2026 |
FY3 2027 |
FY4 2028 |
FY5 2029 |
|---|---|---|---|---|---|---|---|---|---|---|
| Revenue | 141.8 | 170.9 | 217.3 | 279.5 | 271.4 | 321.1 | 380.0 | 449.7 | 532.2 | 629.8 |
| Revenue Growth, % | 0 | 20.52 | 27.13 | 28.61 | -2.92 | 18.34 | 18.34 | 18.34 | 18.34 | 18.34 |
| EBITDA | -10.2 | 92.1 | 15.6 | 87.3 | 9.2 | 56.8 | 67.2 | 79.6 | 94.1 | 111.4 |
| EBITDA, % | -7.23 | 53.9 | 7.17 | 31.22 | 3.39 | 17.69 | 17.69 | 17.69 | 17.69 | 17.69 |
| Depreciation | 57.2 | 57.4 | 56.0 | 53.8 | 51.6 | 88.6 | 104.8 | 124.0 | 146.8 | 173.7 |
| Depreciation, % | 40.3 | 33.58 | 25.75 | 19.26 | 19.03 | 27.58 | 27.58 | 27.58 | 27.58 | 27.58 |
| EBIT | -67.4 | 34.7 | -40.4 | 33.4 | -42.4 | -31.8 | -37.6 | -44.5 | -52.6 | -62.3 |
| EBIT, % | -47.53 | 20.32 | -18.58 | 11.96 | -15.63 | -9.89 | -9.89 | -9.89 | -9.89 | -9.89 |
| Total Cash | 32.7 | 37.6 | 40.0 | 67.5 | 59.5 | 70.3 | 83.2 | 98.5 | 116.5 | 137.9 |
| Total Cash, percent | .0 | .0 | .0 | .0 | .0 | .0 | .0 | .0 | .0 | .0 |
| Account Receivables | 88.6 | 62.9 | 77.3 | 75.8 | 79.4 | 122.8 | 145.3 | 172.0 | 203.5 | 240.9 |
| Account Receivables, % | 62.49 | 36.8 | 35.59 | 27.1 | 29.26 | 38.25 | 38.25 | 38.25 | 38.25 | 38.25 |
| Inventories | .6 | .9 | 2.1 | 1.6 | 2.8 | 2.3 | 2.7 | 3.2 | 3.7 | 4.4 |
| Inventories, % | 0.4061 | 0.54288 | 0.97688 | 0.57565 | 1.02 | 0.70372 | 0.70372 | 0.70372 | 0.70372 | 0.70372 |
| Accounts Payable | 30.0 | 28.4 | 38.0 | 27.6 | 29.2 | 48.7 | 57.6 | 68.2 | 80.7 | 95.5 |
| Accounts Payable, % | 21.13 | 16.63 | 17.46 | 9.86 | 10.77 | 15.17 | 15.17 | 15.17 | 15.17 | 15.17 |
| Capital Expenditure | -20.8 | -7.0 | -.2 | -10.6 | -7.3 | -16.3 | -19.3 | -22.8 | -27.0 | -31.9 |
| Capital Expenditure, % | -14.67 | -4.1 | -0.08512596 | -3.79 | -2.69 | -5.07 | -5.07 | -5.07 | -5.07 | -5.07 |
| Tax Rate, % | 3.24 | 3.24 | 3.24 | 3.24 | 3.24 | 3.24 | 3.24 | 3.24 | 3.24 | 3.24 |
| EBITAT | -50.1 | 53.0 | -45.9 | 604.7 | -41.0 | -29.9 | -35.4 | -41.9 | -49.6 | -58.7 |
| Depreciation | ||||||||||
| Changes in Account Receivables | ||||||||||
| Changes in Inventories | ||||||||||
| Changes in Accounts Payable | ||||||||||
| Capital Expenditure | ||||||||||
| UFCF | -72.9 | 127.3 | 3.8 | 639.6 | .2 | 18.9 | 36.1 | 42.8 | 50.6 | 59.9 |
| WACC, % | 9.14 | 11.02 | 11.02 | 11.02 | 10.79 | 10.6 | 10.6 | 10.6 | 10.6 | 10.6 |
| PV UFCF | ||||||||||
| SUM PV UFCF | 148.3 | |||||||||
| Long Term Growth Rate, % | 2.00 | |||||||||
| Free cash flow (T + 1) | 61 | |||||||||
| Terminal Value | 711 | |||||||||
| Present Terminal Value | 429 | |||||||||
| Enterprise Value | 578 | |||||||||
| Net Debt | 289 | |||||||||
| Equity Value | 289 | |||||||||
| Diluted Shares Outstanding, MM | 28 | |||||||||
| Equity Value Per Share | 10.44 |
What You Will Receive
- Customizable Excel Template: A fully adjustable Excel-based DCF Calculator featuring pre-filled real SMHI financials.
- Authentic Data: Historical figures and forward-looking projections (as indicated in the yellow cells).
- Flexible Forecasting: Adjust forecast parameters such as revenue growth, EBITDA %, and WACC.
- Instant Calculations: Immediately observe the effect of your inputs on SEACOR Marine’s valuation.
- Professional Resource: Designed for investors, CFOs, consultants, and financial analysts.
- Intuitive Layout: Organized for clarity and ease of navigation, complete with step-by-step guidance.
Key Features
- Customizable Operational Metrics: Adjust essential inputs such as fleet utilization, operating costs, and revenue projections.
- Instant DCF Valuation: Quickly computes intrinsic value, NPV, and other financial metrics.
- Industry-Leading Precision: Leverages SEACOR Marine's actual financial data for accurate valuation results.
- Effortless Scenario Testing: Evaluate various assumptions and analyze results with ease.
- Efficiency Boost: Avoid the hassle of constructing intricate valuation models from the ground up.
How It Works
- Step 1: Download the Excel file for SEACOR Marine Holdings Inc. (SMHI).
- Step 2: Review SEACOR's pre-filled financial data and forecasts.
- Step 3: Modify key inputs such as revenue growth, WACC, and tax rates (highlighted cells).
- Step 4: Observe the DCF model update in real-time as you adjust assumptions.
- Step 5: Analyze the outputs and utilize the results for your investment decisions.
Why Choose SEACOR Marine Holdings Inc. (SMHI)?
- Industry Expertise: Benefit from years of experience in marine logistics and transportation.
- Enhanced Safety: Commitment to high safety standards ensures reliable operations.
- Innovative Solutions: Cutting-edge technology and services tailored to meet client needs.
- Global Reach: Extensive network allows for efficient service delivery worldwide.
- Proven Track Record: Trusted by clients for delivering consistent and quality results.
Who Should Use This Product?
- Investors: Accurately assess SEACOR Marine Holdings Inc.'s (SMHI) fair value prior to making investment choices.
- CFOs: Utilize a professional-grade DCF model for comprehensive financial reporting and analysis.
- Consultants: Easily modify the template for valuation reports tailored to clients' needs.
- Entrepreneurs: Acquire insights into financial modeling practices employed by leading marine companies.
- Educators: Employ it as a teaching resource to illustrate valuation methodologies effectively.
What the Template Contains
- Comprehensive DCF Model: Editable template with detailed valuation calculations for SEACOR Marine Holdings Inc. (SMHI).
- Real-World Data: SEACOR Marine's historical and projected financials preloaded for analysis.
- Customizable Parameters: Adjust WACC, growth rates, and tax assumptions to test various scenarios.
- Financial Statements: Full annual and quarterly breakdowns for deeper insights into SEACOR Marine's performance.
- Key Ratios: Built-in analysis for profitability, efficiency, and leverage specific to SEACOR Marine Holdings Inc. (SMHI).
- Dashboard with Visual Outputs: Charts and tables for clear, actionable results tailored to SEACOR Marine Holdings Inc. (SMHI).
Disclaimer
All information, articles, and product details provided on this website are for general informational and educational purposes only. We do not claim any ownership over, nor do we intend to infringe upon, any trademarks, copyrights, logos, brand names, or other intellectual property mentioned or depicted on this site. Such intellectual property remains the property of its respective owners, and any references here are made solely for identification or informational purposes, without implying any affiliation, endorsement, or partnership.
We make no representations or warranties, express or implied, regarding the accuracy, completeness, or suitability of any content or products presented. Nothing on this website should be construed as legal, tax, investment, financial, medical, or other professional advice. In addition, no part of this site—including articles or product references—constitutes a solicitation, recommendation, endorsement, advertisement, or offer to buy or sell any securities, franchises, or other financial instruments, particularly in jurisdictions where such activity would be unlawful.
All content is of a general nature and may not address the specific circumstances of any individual or entity. It is not a substitute for professional advice or services. Any actions you take based on the information provided here are strictly at your own risk. You accept full responsibility for any decisions or outcomes arising from your use of this website and agree to release us from any liability in connection with your use of, or reliance upon, the content or products found herein.