
|
WH SMITH PLC (SMWH.L) DCF VALORACIÓN |
Completamente Editable: Adáptelo A Sus Necesidades En Excel O Sheets
Diseño Profesional: Plantillas Confiables Y Estándares De La Industria
Predeterminadas Para Un Uso Rápido Y Eficiente
Compatible con MAC / PC, completamente desbloqueado
No Se Necesita Experiencia; Fáciles De Seguir
WH Smith PLC (SMWH.L) Bundle
Ya sea que sea un inversor o analista, esta calculadora DCF WH Smith PLC (SMWHL) es su recurso de referencia para una valoración precisa. Cargados con datos reales de WH Smith, puede ajustar los pronósticos y observar instantáneamente los efectos.
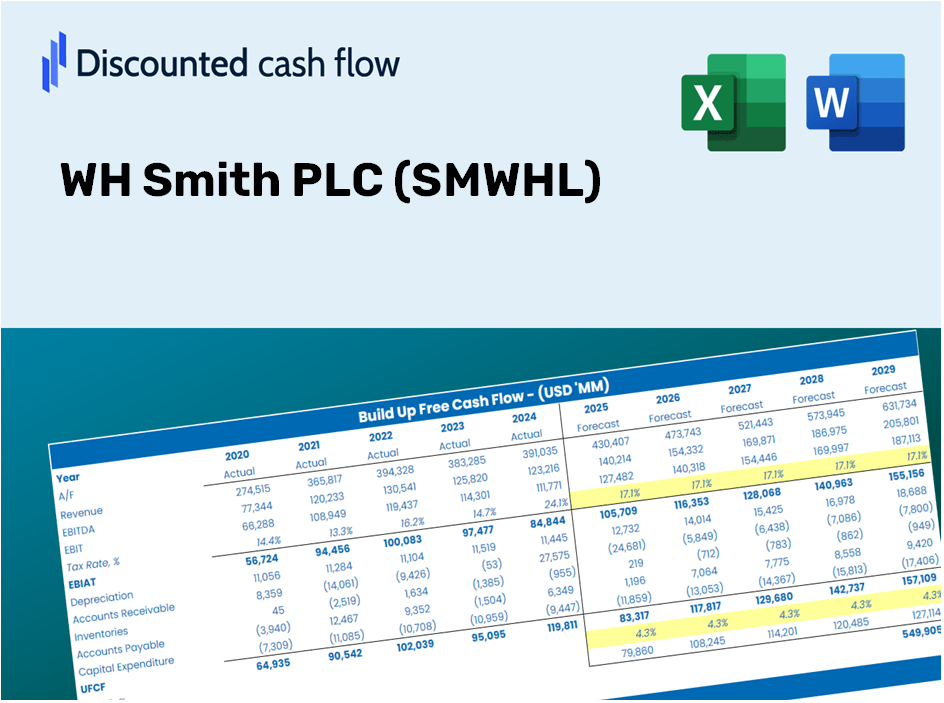
Discounted Cash Flow (DCF) - (USD MM)
| Year | AY1 2020 |
AY2 2021 |
AY3 2022 |
AY4 2023 |
AY5 2024 |
FY1 2025 |
FY2 2026 |
FY3 2027 |
FY4 2028 |
FY5 2029 |
|---|---|---|---|---|---|---|---|---|---|---|
| Revenue | 1,021.0 | 886.0 | 1,400.0 | 1,793.0 | 1,918.0 | 2,300.8 | 2,760.0 | 3,310.9 | 3,971.7 | 4,764.4 |
| Revenue Growth, % | 0 | -13.22 | 58.01 | 28.07 | 6.97 | 19.96 | 19.96 | 19.96 | 19.96 | 19.96 |
| EBITDA | -95.0 | 42.0 | 228.0 | 316.0 | 334.0 | 215.2 | 258.1 | 309.6 | 371.4 | 445.6 |
| EBITDA, % | -9.3 | 4.74 | 16.29 | 17.62 | 17.41 | 9.35 | 9.35 | 9.35 | 9.35 | 9.35 |
| Depreciation | 165.0 | 134.0 | 131.0 | 160.0 | 176.0 | 270.3 | 324.3 | 389.0 | 466.6 | 559.7 |
| Depreciation, % | 16.16 | 15.12 | 9.36 | 8.92 | 9.18 | 11.75 | 11.75 | 11.75 | 11.75 | 11.75 |
| EBIT | -260.0 | -92.0 | 97.0 | 156.0 | 158.0 | -55.1 | -66.1 | -79.3 | -95.2 | -114.2 |
| EBIT, % | -25.47 | -10.38 | 6.93 | 8.7 | 8.24 | -2.4 | -2.4 | -2.4 | -2.4 | -2.4 |
| Total Cash | 108.0 | 130.0 | 132.0 | 56.0 | 56.0 | 187.4 | 224.8 | 269.7 | 323.5 | 388.0 |
| Total Cash, percent | .0 | .0 | .0 | .0 | .0 | .0 | .0 | .0 | .0 | .0 |
| Account Receivables | 47.0 | 28.0 | 67.0 | 100.0 | 133.0 | 115.3 | 138.3 | 165.9 | 199.1 | 238.8 |
| Account Receivables, % | 4.6 | 3.16 | 4.79 | 5.58 | 6.93 | 5.01 | 5.01 | 5.01 | 5.01 | 5.01 |
| Inventories | 150.0 | 135.0 | 198.0 | 205.0 | 217.0 | 307.5 | 368.8 | 442.5 | 530.8 | 636.7 |
| Inventories, % | 14.69 | 15.24 | 14.14 | 11.43 | 11.31 | 13.36 | 13.36 | 13.36 | 13.36 | 13.36 |
| Accounts Payable | 60.0 | 70.0 | 130.0 | 130.0 | 153.0 | 176.2 | 211.4 | 253.5 | 304.2 | 364.9 |
| Accounts Payable, % | 5.88 | 7.9 | 9.29 | 7.25 | 7.98 | 7.66 | 7.66 | 7.66 | 7.66 | 7.66 |
| Capital Expenditure | -79.0 | -44.0 | -83.0 | -122.0 | -131.0 | -148.5 | -178.1 | -213.7 | -256.3 | -307.5 |
| Capital Expenditure, % | -7.74 | -4.97 | -5.93 | -6.8 | -6.83 | -6.45 | -6.45 | -6.45 | -6.45 | -6.45 |
| Tax Rate, % | 36.79 | 36.79 | 36.79 | 36.79 | 36.79 | 36.79 | 36.79 | 36.79 | 36.79 | 36.79 |
| EBITAT | -221.9 | -65.0 | 72.4 | 112.0 | 99.9 | -40.3 | -48.4 | -58.0 | -69.6 | -83.5 |
| Depreciation | ||||||||||
| Changes in Account Receivables | ||||||||||
| Changes in Inventories | ||||||||||
| Changes in Accounts Payable | ||||||||||
| Capital Expenditure | ||||||||||
| UFCF | -272.9 | 69.0 | 78.4 | 110.0 | 122.9 | 31.9 | 48.6 | 58.2 | 69.9 | 83.8 |
| WACC, % | 6.08 | 5.67 | 5.78 | 5.7 | 5.46 | 5.74 | 5.74 | 5.74 | 5.74 | 5.74 |
| PV UFCF | ||||||||||
| SUM PV UFCF | 242.2 | |||||||||
| Long Term Growth Rate, % | 3.50 | |||||||||
| Free cash flow (T + 1) | 87 | |||||||||
| Terminal Value | 3,878 | |||||||||
| Present Terminal Value | 2,934 | |||||||||
| Enterprise Value | 3,176 | |||||||||
| Net Debt | 997 | |||||||||
| Equity Value | 2,179 | |||||||||
| Diluted Shares Outstanding, MM | 131 | |||||||||
| Equity Value Per Share | 1,663.38 |
What You Will Receive
- Authentic SMWHL Financial Data: Pre-loaded with WH Smith's historical and forecasted figures for in-depth analysis.
- Fully Customizable Template: Easily adjust critical inputs such as revenue growth, WACC, and EBITDA percentage.
- Instant Calculations: Watch WH Smith's intrinsic value refresh immediately based on your modifications.
- Expert Valuation Tool: Tailored for investors, analysts, and consultants aiming for precise DCF outcomes.
- User-Friendly Interface: Streamlined layout and straightforward guidance suitable for all skill levels.
Key Features
- Comprehensive DCF Calculator: Features detailed unlevered and levered DCF valuation models tailored for WH Smith PLC (SMWHL).
- WACC Calculator: Pre-configured Weighted Average Cost of Capital sheet with adjustable inputs specific to WH Smith PLC (SMWHL).
- Customizable Forecast Assumptions: Easily modify growth rates, capital expenditures, and discount rates for accurate predictions.
- Integrated Financial Ratios: Evaluate profitability, leverage, and efficiency metrics relevant to WH Smith PLC (SMWHL).
- Interactive Dashboard and Charts: Visual representations provide a concise summary of crucial valuation metrics for streamlined analysis.
How It Operates
- Step 1: Download the Excel template.
- Step 2: Review WH Smith PLC’s pre-filled financial metrics and projections.
- Step 3: Adjust key variables such as revenue growth, WACC, and tax rates (marked cells).
- Step 4: Observe the DCF model refresh in real-time as you alter the assumptions.
- Step 5: Evaluate the results and apply the findings to your investment choices.
Why Choose This Calculator for WH Smith PLC (SMWHL)?
- Precision: Utilizes accurate financial data specific to WH Smith PLC.
- Versatility: Allows users to easily test and adjust various inputs.
- Efficiency: Eliminate the need to create a DCF model from the ground up.
- Expert-Level: Crafted with the expertise expected at the CFO level for exceptional usability.
- Intuitive: Designed for ease of use, accommodating users without extensive financial modeling skills.
Who Can Benefit from This Product?
- Finance Students: Acquire essential valuation skills and practice with real market data.
- Academics: Integrate industry-standard models into your teaching or research projects.
- Investors: Evaluate your own hypotheses and analyze valuation results for WH Smith PLC (SMWHL) stock.
- Analysts: Enhance your efficiency with a customizable, ready-to-use DCF model.
- Small Business Owners: Understand how major public companies like WH Smith PLC (SMWHL) are assessed in the market.
What the Template Contains
- Historical Data: Provides past financial performance and baseline forecasts for WH Smith PLC (SMWHL).
- DCF and Levered DCF Models: Comprehensive templates to assess the intrinsic value of WH Smith PLC (SMWHL).
- WACC Sheet: Pre-configured calculations for the Weighted Average Cost of Capital.
- Editable Inputs: Customize key variables such as growth rates, EBITDA margins, and CAPEX assumptions.
- Quarterly and Annual Statements: A thorough breakdown of WH Smith PLC (SMWHL)'s financials.
- Interactive Dashboard: Dynamically visualize valuation outcomes and projections.
Disclaimer
All information, articles, and product details provided on this website are for general informational and educational purposes only. We do not claim any ownership over, nor do we intend to infringe upon, any trademarks, copyrights, logos, brand names, or other intellectual property mentioned or depicted on this site. Such intellectual property remains the property of its respective owners, and any references here are made solely for identification or informational purposes, without implying any affiliation, endorsement, or partnership.
We make no representations or warranties, express or implied, regarding the accuracy, completeness, or suitability of any content or products presented. Nothing on this website should be construed as legal, tax, investment, financial, medical, or other professional advice. In addition, no part of this site—including articles or product references—constitutes a solicitation, recommendation, endorsement, advertisement, or offer to buy or sell any securities, franchises, or other financial instruments, particularly in jurisdictions where such activity would be unlawful.
All content is of a general nature and may not address the specific circumstances of any individual or entity. It is not a substitute for professional advice or services. Any actions you take based on the information provided here are strictly at your own risk. You accept full responsibility for any decisions or outcomes arising from your use of this website and agree to release us from any liability in connection with your use of, or reliance upon, the content or products found herein.