
|
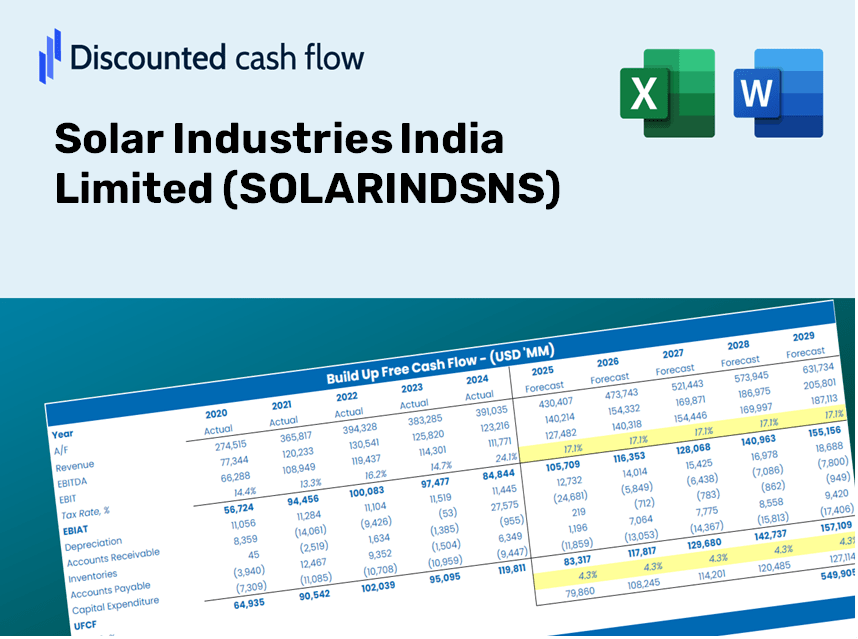
Valoración de DCF de Solar Industries India Limited (solarinds.ns) |
Completamente Editable: Adáptelo A Sus Necesidades En Excel O Sheets
Diseño Profesional: Plantillas Confiables Y Estándares De La Industria
Predeterminadas Para Un Uso Rápido Y Eficiente
Compatible con MAC / PC, completamente desbloqueado
No Se Necesita Experiencia; Fáciles De Seguir
Solar Industries India Limited (SOLARINDS.NS) Bundle
Diseñada para la precisión, nuestra calculadora DCF (SolarIndsns) le permite evaluar la valoración de las industrias solar India Limited utilizando datos financieros reales, que ofrece una flexibilidad completa para modificar todos los parámetros esenciales para obtener pronósticos mejorados.
Discounted Cash Flow (DCF) - (USD MM)
| Year | AY1 2021 |
AY2 2022 |
AY3 2023 |
AY4 2024 |
AY5 2025 |
FY1 2026 |
FY2 2027 |
FY3 2028 |
FY4 2029 |
FY5 2030 |
|---|---|---|---|---|---|---|---|---|---|---|
| Revenue | 25,156.3 | 39,476.1 | 69,225.3 | 60,695.2 | 75,402.6 | 102,583.9 | 139,563.5 | 189,873.5 | 258,319.5 | 351,438.9 |
| Revenue Growth, % | 0 | 56.92 | 75.36 | -12.32 | 24.23 | 36.05 | 36.05 | 36.05 | 36.05 | 36.05 |
| EBITDA | 5,470.2 | 7,884.5 | 13,827.1 | 15,523.5 | 19,195.9 | 23,127.7 | 31,464.8 | 42,807.3 | 58,238.5 | 79,232.5 |
| EBITDA, % | 21.74 | 19.97 | 19.97 | 25.58 | 25.46 | 22.55 | 22.55 | 22.55 | 22.55 | 22.55 |
| Depreciation | 889.3 | 997.5 | 1,164.5 | 1,297.0 | 1,578.7 | 2,456.8 | 3,342.5 | 4,547.4 | 6,186.6 | 8,416.8 |
| Depreciation, % | 3.54 | 2.53 | 1.68 | 2.14 | 2.09 | 2.39 | 2.39 | 2.39 | 2.39 | 2.39 |
| EBIT | 4,580.9 | 6,887.0 | 12,662.6 | 14,226.5 | 17,617.2 | 20,670.9 | 28,122.3 | 38,259.9 | 52,051.9 | 70,815.7 |
| EBIT, % | 18.21 | 17.45 | 18.29 | 23.44 | 23.36 | 20.15 | 20.15 | 20.15 | 20.15 | 20.15 |
| Total Cash | 1,751.8 | 987.5 | 2,790.1 | 4,673.6 | 11,250.3 | 7,409.8 | 10,081.0 | 13,715.0 | 18,659.0 | 25,385.2 |
| Total Cash, percent | .0 | .0 | .0 | .0 | .0 | .0 | .0 | .0 | .0 | .0 |
| Account Receivables | 4,554.8 | 5,411.0 | 8,252.8 | 8,448.5 | 12,385.8 | 15,198.9 | 20,677.9 | 28,131.8 | 38,272.9 | 52,069.5 |
| Account Receivables, % | 18.11 | 13.71 | 11.92 | 13.92 | 16.43 | 14.82 | 14.82 | 14.82 | 14.82 | 14.82 |
| Inventories | 4,728.2 | 8,422.9 | 12,139.2 | 10,195.3 | 12,120.7 | 18,575.9 | 25,272.1 | 34,382.3 | 46,776.5 | 63,638.5 |
| Inventories, % | 18.8 | 21.34 | 17.54 | 16.8 | 16.07 | 18.11 | 18.11 | 18.11 | 18.11 | 18.11 |
| Accounts Payable | 2,860.8 | 4,649.4 | 4,884.8 | 3,229.4 | 4,925.2 | 8,629.1 | 11,739.7 | 15,971.7 | 21,729.2 | 29,562.2 |
| Accounts Payable, % | 11.37 | 11.78 | 7.06 | 5.32 | 6.53 | 8.41 | 8.41 | 8.41 | 8.41 | 8.41 |
| Capital Expenditure | -2,649.6 | -2,874.4 | -4,791.1 | -5,597.5 | -10,059.5 | -9,704.1 | -13,202.2 | -17,961.4 | -24,436.1 | -33,244.9 |
| Capital Expenditure, % | -10.53 | -7.28 | -6.92 | -9.22 | -13.34 | -9.46 | -9.46 | -9.46 | -9.46 | -9.46 |
| Tax Rate, % | 30.44 | 30.44 | 30.44 | 30.44 | 30.44 | 30.44 | 30.44 | 30.44 | 30.44 | 30.44 |
| EBITAT | 3,187.9 | 5,003.3 | 8,703.9 | 10,240.7 | 12,254.2 | 14,573.7 | 19,827.3 | 26,974.7 | 36,698.6 | 49,927.7 |
| Depreciation | ||||||||||
| Changes in Account Receivables | ||||||||||
| Changes in Inventories | ||||||||||
| Changes in Accounts Payable | ||||||||||
| Capital Expenditure | ||||||||||
| UFCF | -4,994.6 | 364.1 | -1,245.4 | 6,033.0 | -393.5 | 1,762.1 | 903.0 | 1,228.5 | 1,671.3 | 2,273.8 |
| WACC, % | 4.71 | 4.71 | 4.71 | 4.71 | 4.71 | 4.71 | 4.71 | 4.71 | 4.71 | 4.71 |
| PV UFCF | ||||||||||
| SUM PV UFCF | 6,772.7 | |||||||||
| Long Term Growth Rate, % | 4.00 | |||||||||
| Free cash flow (T + 1) | 2,365 | |||||||||
| Terminal Value | 331,784 | |||||||||
| Present Terminal Value | 263,547 | |||||||||
| Enterprise Value | 270,319 | |||||||||
| Net Debt | 7,812 | |||||||||
| Equity Value | 262,507 | |||||||||
| Diluted Shares Outstanding, MM | 90 | |||||||||
| Equity Value Per Share | 2,900.86 |
What You Will Receive
- Authentic SOLARINDSNS Financial Data: Pre-filled with Solar Industries India's historical and projected figures for accurate analysis.
- Fully Customizable Template: Easily adjust essential inputs such as revenue growth, WACC, and EBITDA %.
- Instant Calculations: Watch SOLARINDSNS's intrinsic value refresh immediately as you make changes.
- Professional Valuation Tool: Crafted for investors, analysts, and consultants aiming for precise DCF results.
- User-Friendly Layout: Simple design and clear guidance suitable for users of all experience levels.
Key Features
- Accurate Financial Data for Solar Industries: Gain access to reliable pre-loaded historical figures and future forecasts.
- Adjustable Forecast Parameters: Modify the yellow-highlighted cells such as WACC, growth rates, and profit margins.
- Real-Time Calculations: Automatically refresh DCF, Net Present Value (NPV), and cash flow analysis as changes are made.
- User-Friendly Dashboard: Intuitive charts and summaries that make it easy to visualize your valuation insights.
- Designed for All Skill Levels: A straightforward, user-friendly layout tailored for investors, CFOs, and consultants alike.
How It Works
- Download the Template: Gain immediate access to the Excel-based SOLARINDSNS DCF Calculator.
- Input Your Assumptions: Modify the yellow-highlighted cells for growth rates, WACC, margins, and more.
- Instant Calculations: The model automatically refreshes Solar Industries' intrinsic value.
- Test Scenarios: Experiment with various assumptions to assess potential shifts in valuation.
- Analyze and Decide: Utilize the outcomes to inform your investment or financial analysis.
Why Opt for This Calculator?
- Reliable Data: Utilize accurate financial information from Solar Industries India Limited to achieve trustworthy valuation outcomes.
- Customizable Features: Tailor essential variables such as growth rates, WACC, and tax rates to align with your forecasts.
- Efficiency Boost: Pre-configured calculations help you avoid starting from ground zero.
- Professional-Quality Tool: Tailored for investors, analysts, and consultants seeking detailed insights.
- User-Centric Design: A straightforward interface and guided steps ensure accessibility for all users.
Who Can Benefit from Solar Industries India Limited (SOLARINDSNS)?
- Investors: Make informed choices using a high-quality valuation tool tailored for the solar industry.
- Financial Analysts: Streamline your workflow with a customizable DCF model designed for solar sector analysis.
- Consultants: Effortlessly modify the template for client proposals or industry reports related to Solar Industries.
- Finance Enthusiasts: Enhance your knowledge of valuation methods through practical examples from Solar Industries.
- Educators and Students: Utilize this resource as a hands-on learning aid in finance and investment courses focused on renewable energy.
Contents of the Template
- Pre-Filled Data: Contains Solar Industries India's historical financial performance and projections.
- Discounted Cash Flow Model: Customizable DCF valuation model with automated calculations.
- Weighted Average Cost of Capital (WACC): A specific sheet for calculating WACC using user-defined inputs.
- Key Financial Ratios: Evaluate Solar Industries India's profitability, operational efficiency, and financial leverage.
- Customizable Inputs: Easily modify revenue growth, profit margins, and tax rates.
- User-Friendly Dashboard: Visualizations and tables that summarize the main valuation outcomes.
Disclaimer
All information, articles, and product details provided on this website are for general informational and educational purposes only. We do not claim any ownership over, nor do we intend to infringe upon, any trademarks, copyrights, logos, brand names, or other intellectual property mentioned or depicted on this site. Such intellectual property remains the property of its respective owners, and any references here are made solely for identification or informational purposes, without implying any affiliation, endorsement, or partnership.
We make no representations or warranties, express or implied, regarding the accuracy, completeness, or suitability of any content or products presented. Nothing on this website should be construed as legal, tax, investment, financial, medical, or other professional advice. In addition, no part of this site—including articles or product references—constitutes a solicitation, recommendation, endorsement, advertisement, or offer to buy or sell any securities, franchises, or other financial instruments, particularly in jurisdictions where such activity would be unlawful.
All content is of a general nature and may not address the specific circumstances of any individual or entity. It is not a substitute for professional advice or services. Any actions you take based on the information provided here are strictly at your own risk. You accept full responsibility for any decisions or outcomes arising from your use of this website and agree to release us from any liability in connection with your use of, or reliance upon, the content or products found herein.