
|
Valoración DCF de SOPHiA GENETICS SA (SOPH) |
Completamente Editable: Adáptelo A Sus Necesidades En Excel O Sheets
Diseño Profesional: Plantillas Confiables Y Estándares De La Industria
Predeterminadas Para Un Uso Rápido Y Eficiente
Compatible con MAC / PC, completamente desbloqueado
No Se Necesita Experiencia; Fáciles De Seguir
SOPHiA GENETICS SA (SOPH) Bundle
¡Evalúa la perspectiva financiera de Sophia Genetics SA (Soph) como un experto! Esta calculadora DCF (SOPH) proporciona datos financieros previamente llenos y ofrece flexibilidad total para modificar el crecimiento de los ingresos, WACC, los márgenes y otros supuestos esenciales para alinearse con sus proyecciones.
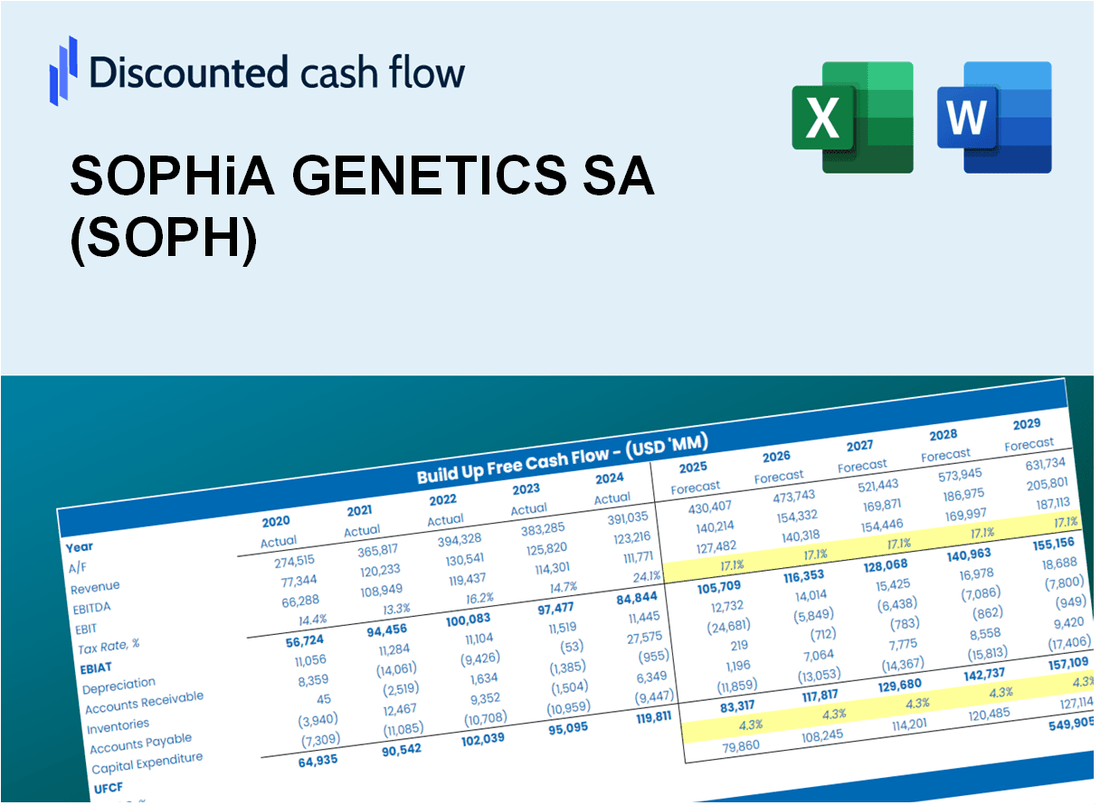
Discounted Cash Flow (DCF) - (USD MM)
| Year | AY1 2020 |
AY2 2021 |
AY3 2022 |
AY4 2023 |
AY5 2024 |
FY1 2025 |
FY2 2026 |
FY3 2027 |
FY4 2028 |
FY5 2029 |
|---|---|---|---|---|---|---|---|---|---|---|
| Revenue | 28.4 | 40.5 | 47.6 | 62.4 | 65.2 | 80.8 | 100.1 | 124.0 | 153.6 | 190.4 |
| Revenue Growth, % | 0 | 42.43 | 17.58 | 31.14 | 4.49 | 23.91 | 23.91 | 23.91 | 23.91 | 23.91 |
| EBITDA | -38.0 | -69.2 | -81.4 | -69.6 | -50.8 | -77.2 | -95.6 | -118.5 | -146.8 | -182.0 |
| EBITDA, % | -133.79 | -171.17 | -171.1 | -111.54 | -77.89 | -95.58 | -95.58 | -95.58 | -95.58 | -95.58 |
| Depreciation | 2.4 | 3.6 | 5.6 | 8.3 | 8.6 | 9.0 | 11.1 | 13.8 | 17.1 | 21.2 |
| Depreciation, % | 8.42 | 8.92 | 11.71 | 13.37 | 13.19 | 11.12 | 11.12 | 11.12 | 11.12 | 11.12 |
| EBIT | -40.4 | -72.8 | -86.9 | -77.9 | -59.4 | -79.3 | -98.3 | -121.8 | -150.9 | -187.0 |
| EBIT, % | -142.2 | -180.1 | -182.81 | -124.91 | -91.08 | -98.22 | -98.22 | -98.22 | -98.22 | -98.22 |
| Total Cash | 97.3 | 265.3 | 178.6 | 123.3 | 80.2 | 80.8 | 100.1 | 124.0 | 153.6 | 190.4 |
| Total Cash, percent | .0 | .0 | .0 | .0 | .0 | .0 | .0 | .0 | .0 | .0 |
| Account Receivables | 7.9 | 7.1 | 8.1 | 15.2 | 8.7 | 16.1 | 20.0 | 24.8 | 30.7 | 38.0 |
| Account Receivables, % | 27.65 | 17.53 | 16.93 | 24.38 | 13.33 | 19.96 | 19.96 | 19.96 | 19.96 | 19.96 |
| Inventories | 3.4 | 5.7 | 5.2 | 6.5 | 5.9 | 9.1 | 11.3 | 14.0 | 17.3 | 21.4 |
| Inventories, % | 11.92 | 14.16 | 10.84 | 10.39 | 9 | 11.26 | 11.26 | 11.26 | 11.26 | 11.26 |
| Accounts Payable | 1.3 | 2.3 | 2.2 | 2.3 | 1.9 | 3.5 | 4.3 | 5.3 | 6.6 | 8.2 |
| Accounts Payable, % | 4.51 | 5.78 | 4.56 | 3.62 | 2.96 | 4.29 | 4.29 | 4.29 | 4.29 | 4.29 |
| Capital Expenditure | -3.2 | -6.7 | -10.4 | -9.2 | -8.2 | -12.4 | -15.4 | -19.1 | -23.6 | -29.3 |
| Capital Expenditure, % | -11.28 | -16.49 | -21.83 | -14.79 | -12.55 | -15.39 | -15.39 | -15.39 | -15.39 | -15.39 |
| Tax Rate, % | -2 | -2 | -2 | -2 | -2 | -2 | -2 | -2 | -2 | -2 |
| EBITAT | -38.5 | -73.0 | -86.8 | -78.4 | -60.5 | -78.6 | -97.3 | -120.6 | -149.5 | -185.2 |
| Depreciation | ||||||||||
| Changes in Account Receivables | ||||||||||
| Changes in Inventories | ||||||||||
| Changes in Accounts Payable | ||||||||||
| Capital Expenditure | ||||||||||
| UFCF | -49.3 | -76.6 | -92.2 | -87.7 | -53.3 | -91.1 | -106.8 | -132.4 | -164.0 | -203.2 |
| WACC, % | 8.69 | 8.72 | 8.72 | 8.72 | 8.72 | 8.71 | 8.71 | 8.71 | 8.71 | 8.71 |
| PV UFCF | ||||||||||
| SUM PV UFCF | -528.5 | |||||||||
| Long Term Growth Rate, % | 2.00 | |||||||||
| Free cash flow (T + 1) | -207 | |||||||||
| Terminal Value | -3,089 | |||||||||
| Present Terminal Value | -2,034 | |||||||||
| Enterprise Value | -2,563 | |||||||||
| Net Debt | -50 | |||||||||
| Equity Value | -2,513 | |||||||||
| Diluted Shares Outstanding, MM | 66 | |||||||||
| Equity Value Per Share | -38.20 |
What You Will Get
- Authentic SOPHiA Data: Preloaded financial metrics – including revenue and EBIT – derived from real and projected data.
- Comprehensive Customization: Modify all essential parameters (yellow cells) such as WACC, growth %, and tax rates.
- Real-Time Valuation Updates: Automatic recalculations to assess the effects of changes on SOPHiA GENETICS’ fair value.
- Flexible Excel Template: Designed for quick modifications, scenario analysis, and in-depth forecasts.
- Efficient and Precise: Bypass the need to create models from the ground up while ensuring accuracy and adaptability.
Key Features
- Comprehensive Genomic Data Analysis: Leverage advanced algorithms to interpret complex genomic data.
- Integrated Data Sharing Platform: Seamlessly collaborate with healthcare providers and researchers through a secure interface.
- Customizable Reporting Tools: Tailor reports to meet specific research and clinical needs.
- Real-Time Analytics: Gain insights from live data to enhance decision-making processes.
- User-Friendly Dashboard: Intuitive visualizations make it easy to track and analyze key genomic metrics.
How It Works
- Step 1: Download the Excel file.
- Step 2: Review pre-entered SOPHiA GENETICS data (historical and projected).
- Step 3: Adjust key assumptions (yellow cells) based on your analysis.
- Step 4: View automatic recalculations for SOPHiA GENETICS' intrinsic value.
- Step 5: Use the outputs for investment decisions or reporting.
Why Choose SOPHiA GENETICS SA (SOPH)?
- Streamline Your Process: No need to build complex genetic analysis tools from scratch – they’re readily available.
- Enhance Precision: Access to dependable genomic data and algorithms minimizes errors in analysis.
- Completely Adaptable: Customize the tools to align with your specific research needs and objectives.
- User-Friendly Interface: Intuitive visualizations and outputs simplify the interpretation of results.
- Endorsed by Professionals: Crafted for experts who prioritize accuracy and functionality.
Who Should Use This Product?
- Genetics Students: Explore genomic data analysis techniques and apply them using real-world examples.
- Researchers: Integrate advanced genomic models into your studies or clinical trials.
- Healthcare Professionals: Validate your hypotheses and evaluate genomic outcomes for SOPHiA GENETICS SA (SOPH).
- Bioinformaticians: Enhance your analysis with a comprehensive, customizable genomic data platform.
- Pharmaceutical Companies: Understand how genomic data is utilized in the evaluation of drug efficacy and safety.
What the Template Contains
- Preloaded SOPH Data: Historical and projected financial data, including revenue, EBIT, and capital expenditures.
- DCF and WACC Models: Professional-grade sheets for calculating intrinsic value and Weighted Average Cost of Capital.
- Editable Inputs: Yellow-highlighted cells for adjusting revenue growth, tax rates, and discount rates.
- Financial Statements: Comprehensive annual and quarterly financials for deeper analysis.
- Key Ratios: Profitability, leverage, and efficiency ratios to evaluate performance.
- Dashboard and Charts: Visual summaries of valuation outcomes and assumptions.
Disclaimer
All information, articles, and product details provided on this website are for general informational and educational purposes only. We do not claim any ownership over, nor do we intend to infringe upon, any trademarks, copyrights, logos, brand names, or other intellectual property mentioned or depicted on this site. Such intellectual property remains the property of its respective owners, and any references here are made solely for identification or informational purposes, without implying any affiliation, endorsement, or partnership.
We make no representations or warranties, express or implied, regarding the accuracy, completeness, or suitability of any content or products presented. Nothing on this website should be construed as legal, tax, investment, financial, medical, or other professional advice. In addition, no part of this site—including articles or product references—constitutes a solicitation, recommendation, endorsement, advertisement, or offer to buy or sell any securities, franchises, or other financial instruments, particularly in jurisdictions where such activity would be unlawful.
All content is of a general nature and may not address the specific circumstances of any individual or entity. It is not a substitute for professional advice or services. Any actions you take based on the information provided here are strictly at your own risk. You accept full responsibility for any decisions or outcomes arising from your use of this website and agree to release us from any liability in connection with your use of, or reliance upon, the content or products found herein.