
|
Société de Servicios, de participaciones, de dirección et d'lo elaboration Société Anonymeo (Spa.Br) DCF Valoración |
Completamente Editable: Adáptelo A Sus Necesidades En Excel O Sheets
Diseño Profesional: Plantillas Confiables Y Estándares De La Industria
Predeterminadas Para Un Uso Rápido Y Eficiente
Compatible con MAC / PC, completamente desbloqueado
No Se Necesita Experiencia; Fáciles De Seguir
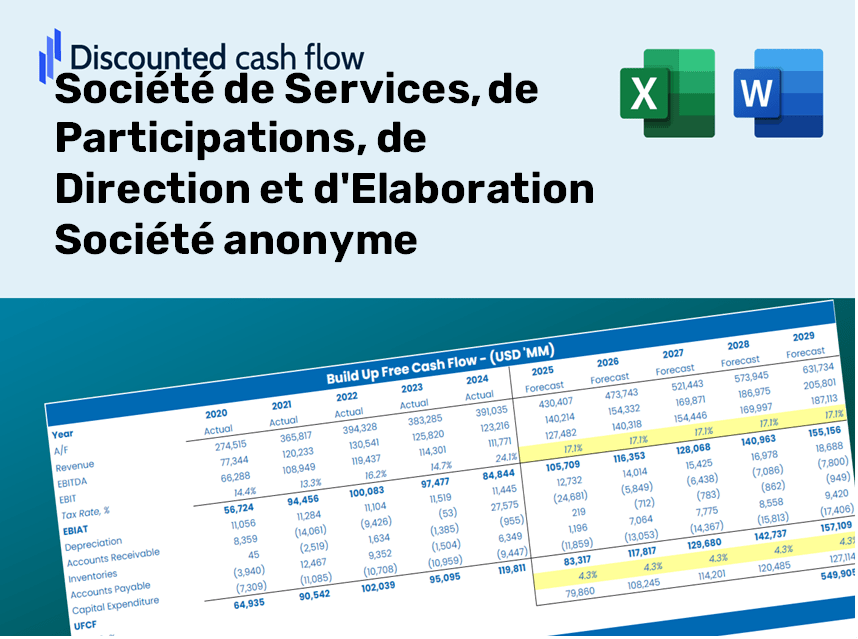
Société de Services, de Participations, de Direction et d'Elaboration SA (SPA.BR) Bundle
¡Agilice su análisis y mejore la precisión con nuestra calculadora DCF (SPABR)! Equipado con datos en tiempo real de SPABR y suposiciones personalizables, esta herramienta le permite pronosticar, analizar y valorar los servicios société de, de participaciones, de dirección et d'Elaboración como un inversionista experimentado.
What You Will Receive
- Genuine SPABR Data: Comprehensive financial information – encompassing revenue to EBIT – rooted in real and forecasted figures.
- Complete Customization: Modify all essential parameters (highlighted cells) such as WACC, growth %, and tax rates.
- Instant Valuation Adjustments: Automatic recalculations to evaluate the effect of modifications on SPABR’s fair value.
- Flexible Excel Template: Designed for swift edits, scenario analysis, and thorough projections.
- Efficient and Precise: Avoid the hassle of building models from the ground up while ensuring accuracy and adaptability.
Key Features
- Comprehensive Data: Historical financial statements and pre-populated forecasts for SPABR (SPABR).
- Customizable Parameters: Modify WACC, tax rates, revenue growth, and EBITDA margins as needed.
- Real-Time Insights: Watch the intrinsic value of SPABR (SPABR) update instantly.
- Visual Performance Metrics: Dashboard charts showcase valuation outcomes and essential metrics.
- Designed for Precision: A top-tier tool tailored for analysts, investors, and finance professionals.
How It Works
- Download: Get the pre-packed Excel file containing SPABR's financial performance data.
- Customize: Tailor your forecasts, such as revenue growth, EBITDA %, and WACC to your needs.
- Update Automatically: Watch as intrinsic value and NPV calculations refresh in real-time.
- Test Scenarios: Generate various projections and instantly compare the results.
- Make Decisions: Leverage the valuation outcomes to inform your investment approach.
Why Opt for SPABR's Calculator?
- Reliable Data: Utilize verified financial metrics from SPABR to achieve accurate valuation outcomes.
- Tailorable: Modify essential variables such as growth forecasts, WACC, and tax rates to align with your specific estimates.
- Efficiency Boost: Integrated calculations save you the hassle of building from the ground up.
- Expert-Level Tool: Specifically crafted for investors, analysts, and consultant professionals.
- Easy to Use: A clear layout and guided instructions ensure accessibility for all users.
Who Can Benefit from SPABR's Services?
- Investors: Accurately assess the fair value of SPABR’s offerings before making financial commitments.
- CFOs: Utilize a top-tier DCF model for comprehensive financial reporting and analysis.
- Consultants: Efficiently customize the template for client valuation reports.
- Entrepreneurs: Acquire valuable insights into financial modeling practices employed by leading firms.
- Educators: Leverage this resource as a tool for teaching valuation techniques.
What the Template Contains
- Historical Data: Contains SPABR's historical financial performance and initial forecasts.
- DCF and Levered DCF Models: Comprehensive templates for determining the intrinsic value of SPABR.
- WACC Sheet: Pre-configured calculations for Weighted Average Cost of Capital.
- Editable Inputs: Adjust key metrics such as growth rates, EBITDA percentages, and CAPEX assumptions.
- Quarterly and Annual Statements: An in-depth overview of SPABR's financial statements.
- Interactive Dashboard: Dynamically visualize valuation outcomes and projections.
Disclaimer
All information, articles, and product details provided on this website are for general informational and educational purposes only. We do not claim any ownership over, nor do we intend to infringe upon, any trademarks, copyrights, logos, brand names, or other intellectual property mentioned or depicted on this site. Such intellectual property remains the property of its respective owners, and any references here are made solely for identification or informational purposes, without implying any affiliation, endorsement, or partnership.
We make no representations or warranties, express or implied, regarding the accuracy, completeness, or suitability of any content or products presented. Nothing on this website should be construed as legal, tax, investment, financial, medical, or other professional advice. In addition, no part of this site—including articles or product references—constitutes a solicitation, recommendation, endorsement, advertisement, or offer to buy or sell any securities, franchises, or other financial instruments, particularly in jurisdictions where such activity would be unlawful.
All content is of a general nature and may not address the specific circumstances of any individual or entity. It is not a substitute for professional advice or services. Any actions you take based on the information provided here are strictly at your own risk. You accept full responsibility for any decisions or outcomes arising from your use of this website and agree to release us from any liability in connection with your use of, or reliance upon, the content or products found herein.