
|
Star Health and Allied Insurance Company Limited (StarHealth.NS) Valoración de DCF |
Completamente Editable: Adáptelo A Sus Necesidades En Excel O Sheets
Diseño Profesional: Plantillas Confiables Y Estándares De La Industria
Predeterminadas Para Un Uso Rápido Y Eficiente
Compatible con MAC / PC, completamente desbloqueado
No Se Necesita Experiencia; Fáciles De Seguir
Star Health and Allied Insurance Company Limited (STARHEALTH.NS) Bundle
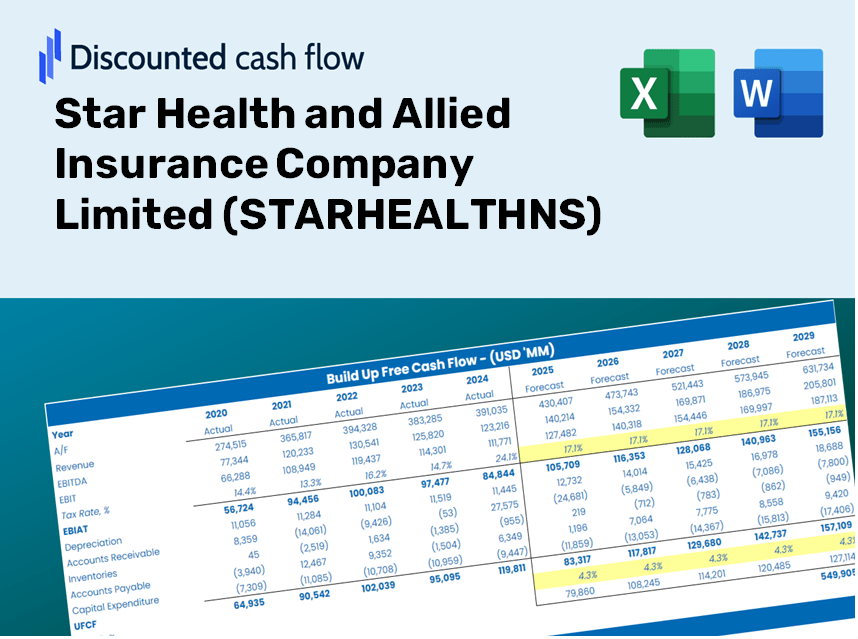
¡Obtenga información sobre su análisis de valoración de Star Health and Allied Insurance Company Limited (StarHealhns) utilizando nuestra sofisticada calculadora DCF! Esta plantilla de Excel se precede con datos reales (StarHealthns), lo que le permite ajustar los pronósticos y los supuestos para determinar con precisión el valor intrínseco de Star Health y Allied Insurance Company Limited.
Discounted Cash Flow (DCF) - (USD MM)
| Year | AY1 2021 |
AY2 2022 |
AY3 2023 |
AY4 2024 |
AY5 2025 |
FY1 2026 |
FY2 2027 |
FY3 2028 |
FY4 2029 |
FY5 2030 |
|---|---|---|---|---|---|---|---|---|---|---|
| Revenue | 50,506.4 | 106,019.8 | 121,000.2 | 144,501.6 | 161,121.5 | 219,549.8 | 299,166.2 | 407,654.3 | 555,484.0 | 756,921.9 |
| Revenue Growth, % | 0 | 109.91 | 14.13 | 19.42 | 11.5 | 36.26 | 36.26 | 36.26 | 36.26 | 36.26 |
| EBITDA | -9,718.5 | -13,049.5 | 9,668.9 | 12,677.0 | 8,610.5 | -4,146.4 | -5,650.1 | -7,699.0 | -10,490.9 | -14,295.2 |
| EBITDA, % | -19.24 | -12.31 | 7.99 | 8.77 | 5.34 | -1.89 | -1.89 | -1.89 | -1.89 | -1.89 |
| Depreciation | 457.3 | 433.0 | 520.7 | 587.1 | .0 | 944.2 | 1,286.7 | 1,753.2 | 2,389.0 | 3,255.4 |
| Depreciation, % | 0.90542 | 0.4084 | 0.43031 | 0.40627 | 0 | 0.43008 | 0.43008 | 0.43008 | 0.43008 | 0.43008 |
| EBIT | -10,175.8 | -13,482.5 | 9,148.2 | 12,089.9 | 8,610.5 | -5,090.7 | -6,936.7 | -9,452.2 | -12,879.9 | -17,550.6 |
| EBIT, % | -20.15 | -12.72 | 7.56 | 8.37 | 5.34 | -2.32 | -2.32 | -2.32 | -2.32 | -2.32 |
| Total Cash | 21,019.6 | 12,115.0 | 10,487.3 | 13,679.6 | 6,584.3 | 33,048.9 | 45,033.6 | 61,364.4 | 83,617.2 | 113,939.8 |
| Total Cash, percent | .0 | .0 | .0 | .0 | .0 | .0 | .0 | .0 | .0 | .0 |
| Account Receivables | 1,701.1 | 2,851.8 | 3,130.4 | 3,839.2 | .0 | 4,962.7 | 6,762.4 | 9,214.6 | 12,556.2 | 17,109.5 |
| Account Receivables, % | 3.37 | 2.69 | 2.59 | 2.66 | 0 | 2.26 | 2.26 | 2.26 | 2.26 | 2.26 |
| Inventories | .0 | .0 | .0 | .0 | .0 | .0 | .0 | .0 | .0 | .0 |
| Inventories, % | 0 | 0 | 0 | 0 | 0 | 0 | 0 | 0 | 0 | 0 |
| Accounts Payable | 173.5 | 993.7 | 995.4 | 727.8 | .0 | 1,144.8 | 1,559.9 | 2,125.6 | 2,896.4 | 3,946.7 |
| Accounts Payable, % | 0.3435 | 0.93731 | 0.82262 | 0.50366 | 0 | 0.52142 | 0.52142 | 0.52142 | 0.52142 | 0.52142 |
| Capital Expenditure | -460.9 | -631.3 | -465.9 | -1,234.9 | -827.1 | -1,431.9 | -1,951.1 | -2,658.7 | -3,622.8 | -4,936.5 |
| Capital Expenditure, % | -0.91247 | -0.59544 | -0.38505 | -0.85461 | -0.51334 | -0.65218 | -0.65218 | -0.65218 | -0.65218 | -0.65218 |
| Tax Rate, % | 24.99 | 24.99 | 24.99 | 24.99 | 24.99 | 24.99 | 24.99 | 24.99 | 24.99 | 24.99 |
| EBITAT | -7,641.4 | -10,046.2 | 6,847.8 | 9,050.0 | 6,458.6 | -3,811.1 | -5,193.2 | -7,076.4 | -9,642.5 | -13,139.3 |
| Depreciation | ||||||||||
| Changes in Account Receivables | ||||||||||
| Changes in Inventories | ||||||||||
| Changes in Accounts Payable | ||||||||||
| Capital Expenditure | ||||||||||
| UFCF | -9,172.7 | -10,574.9 | 6,625.6 | 7,425.8 | 8,742.9 | -8,116.7 | -7,242.1 | -9,868.4 | -13,447.0 | -18,323.4 |
| WACC, % | 4.63 | 4.62 | 4.62 | 4.62 | 4.63 | 4.62 | 4.62 | 4.62 | 4.62 | 4.62 |
| PV UFCF | ||||||||||
| SUM PV UFCF | -48,829.0 | |||||||||
| Long Term Growth Rate, % | 2.00 | |||||||||
| Free cash flow (T + 1) | -18,690 | |||||||||
| Terminal Value | -712,024 | |||||||||
| Present Terminal Value | -567,962 | |||||||||
| Enterprise Value | -616,791 | |||||||||
| Net Debt | -1,984 | |||||||||
| Equity Value | -614,807 | |||||||||
| Diluted Shares Outstanding, MM | 595 | |||||||||
| Equity Value Per Share | -1,033.78 |
Benefits You Will Receive
- Adjustable Forecast Parameters: Effortlessly modify key assumptions (growth %, margins, WACC) to explore various scenarios.
- Comprehensive Data: STARHEALTHNS’s financial information pre-loaded to streamline your analysis.
- Instant DCF Calculations: The template automatically computes Net Present Value (NPV) and intrinsic value for your convenience.
- Fully Customizable and Professional: A refined Excel model tailored to meet your valuation requirements.
- Designed for Analysts and Investors: Perfect for evaluating projections, confirming strategies, and enhancing efficiency.
Key Features
- Comprehensive DCF Calculator: Offers detailed unlevered and levered DCF valuation models tailored for Star Health and Allied Insurance Company Limited (STARHEALTHNS).
- WACC Calculator: Features a pre-built Weighted Average Cost of Capital sheet with adjustable inputs specific to the insurance sector.
- Customizable Forecast Assumptions: Easily adjust growth rates, capital expenditures, and discount rates to align with market trends.
- Integrated Financial Ratios: Evaluate profitability, leverage, and efficiency ratios for Star Health and Allied Insurance Company Limited (STARHEALTHNS).
- Visual Dashboard and Charts: Provides visual representations that encapsulate key valuation metrics for straightforward analysis.
How It Works
- Step 1: Download the Excel file.
- Step 2: Review STARHEALTHNS’s pre-filled financial data and forecasts.
- Step 3: Adjust crucial inputs such as premium growth, expense ratios, and claims ratios (highlighted cells).
- Step 4: Observe the DCF model refresh in real-time as you modify the assumptions.
- Step 5: Evaluate the outputs and leverage the findings for your investment strategies.
Why Opt for STARHEALTHNS Calculator?
- Precision: Utilizes real financial data from Star Health for reliable outcomes.
- Adaptability: Built to allow users to easily adjust and test various inputs.
- Efficiency: Eliminate the need to construct a financial model from the ground up.
- Expert-Level: Crafted with the expertise and functionality expected at the CFO level.
- Intuitive: Simple to navigate, even for individuals without extensive financial modeling skills.
Who Can Benefit from STARHEALTHNS?
- Individual Policyholders: Make confident choices regarding your health insurance coverage options.
- Insurance Analysts: Enhance risk assessment and pricing models with comprehensive data on STARHEALTHNS.
- Insurance Brokers: Provide clients with swift, reliable insights into STARHEALTHNS policies.
- Healthcare Providers: Gain insights into health insurance valuations to align services with market offerings.
- Students of Finance or Insurance: Explore insurance valuation methodologies using real-life examples and case studies.
Contents of the Template
- Preloaded STARHEALTHNS Data: Historical and projected financial metrics, such as premium income, claims ratio, and operating expenses.
- DCF and WACC Models: Advanced spreadsheets for determining intrinsic value and Weighted Average Cost of Capital.
- Editable Inputs: Cells highlighted in yellow for modifying premium growth rates, loss ratios, and discount factors.
- Financial Statements: Detailed annual and quarterly financial reports for thorough analysis.
- Key Ratios: Metrics for profitability, solvency, and operational efficiency to assess performance.
- Dashboard and Charts: Visual representations of valuation results and underlying assumptions.
Disclaimer
All information, articles, and product details provided on this website are for general informational and educational purposes only. We do not claim any ownership over, nor do we intend to infringe upon, any trademarks, copyrights, logos, brand names, or other intellectual property mentioned or depicted on this site. Such intellectual property remains the property of its respective owners, and any references here are made solely for identification or informational purposes, without implying any affiliation, endorsement, or partnership.
We make no representations or warranties, express or implied, regarding the accuracy, completeness, or suitability of any content or products presented. Nothing on this website should be construed as legal, tax, investment, financial, medical, or other professional advice. In addition, no part of this site—including articles or product references—constitutes a solicitation, recommendation, endorsement, advertisement, or offer to buy or sell any securities, franchises, or other financial instruments, particularly in jurisdictions where such activity would be unlawful.
All content is of a general nature and may not address the specific circumstances of any individual or entity. It is not a substitute for professional advice or services. Any actions you take based on the information provided here are strictly at your own risk. You accept full responsibility for any decisions or outcomes arising from your use of this website and agree to release us from any liability in connection with your use of, or reliance upon, the content or products found herein.