
|
Valoración DCF de S&T Bancorp, Inc. (STBA) |
Completamente Editable: Adáptelo A Sus Necesidades En Excel O Sheets
Diseño Profesional: Plantillas Confiables Y Estándares De La Industria
Predeterminadas Para Un Uso Rápido Y Eficiente
Compatible con MAC / PC, completamente desbloqueado
No Se Necesita Experiencia; Fáciles De Seguir
S&T Bancorp, Inc. (STBA) Bundle
¡Lleve su análisis de S&T Bancorp, Inc. (STBA) al siguiente nivel! Esta calculadora DCF (STBA) viene con finanzas prepobladas y ofrece una flexibilidad total para modificar el crecimiento de los ingresos, WACC, los márgenes y otros supuestos esenciales para alinearse con sus proyecciones.
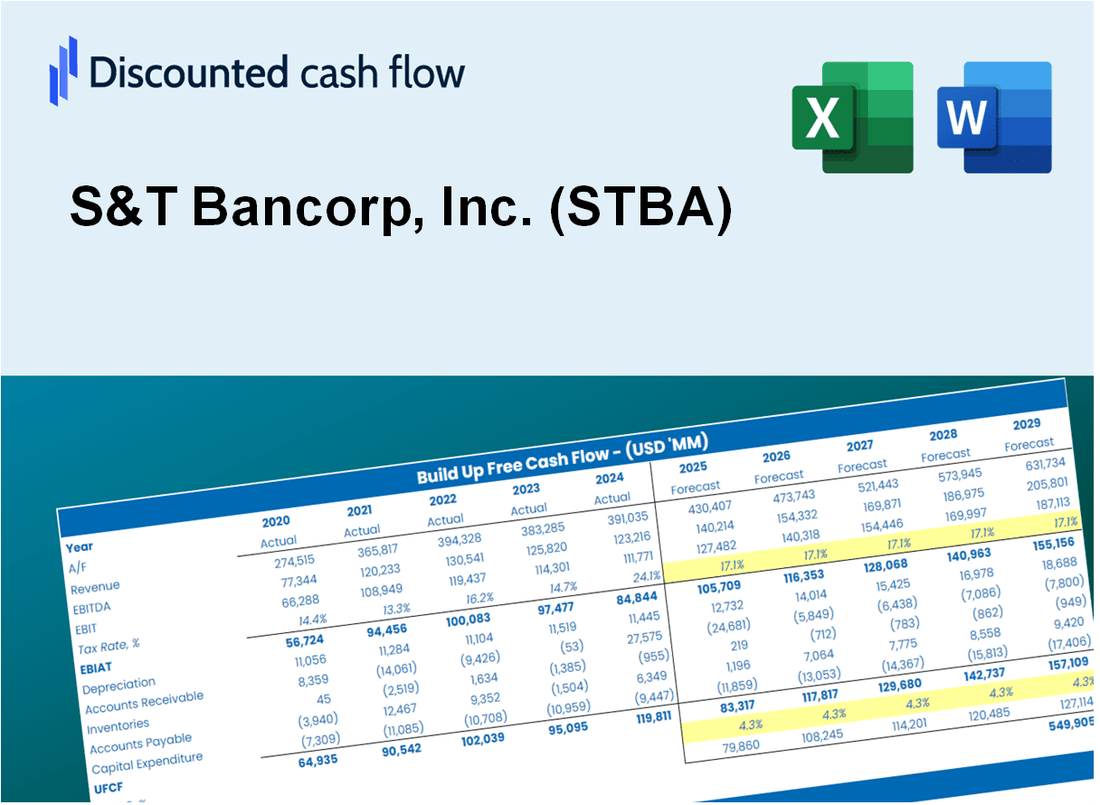
Discounted Cash Flow (DCF) - (USD MM)
| Year | AY1 2020 |
AY2 2021 |
AY3 2022 |
AY4 2023 |
AY5 2024 |
FY1 2025 |
FY2 2026 |
FY3 2027 |
FY4 2028 |
FY5 2029 |
|---|---|---|---|---|---|---|---|---|---|---|
| Revenue | 380.2 | 354.0 | 399.0 | 535.5 | 565.0 | 629.3 | 700.9 | 780.7 | 869.5 | 968.5 |
| Revenue Growth, % | 0 | -6.9 | 12.73 | 34.21 | 5.5 | 11.38 | 11.38 | 11.38 | 11.38 | 11.38 |
| EBITDA | 33.1 | 147.1 | 178.0 | 186.3 | 175.7 | 202.3 | 225.4 | 251.0 | 279.6 | 311.4 |
| EBITDA, % | 8.71 | 41.57 | 44.6 | 34.79 | 31.1 | 32.15 | 32.15 | 32.15 | 32.15 | 32.15 |
| Depreciation | 12.1 | 11.5 | 9.0 | 7.5 | 10.9 | 15.1 | 16.8 | 18.7 | 20.9 | 23.3 |
| Depreciation, % | 3.17 | 3.24 | 2.26 | 1.4 | 1.92 | 2.4 | 2.4 | 2.4 | 2.4 | 2.4 |
| EBIT | 21.0 | 135.7 | 168.9 | 178.8 | 164.8 | 187.2 | 208.5 | 232.3 | 258.7 | 288.2 |
| EBIT, % | 5.53 | 38.33 | 42.34 | 33.39 | 29.17 | 29.75 | 29.75 | 29.75 | 29.75 | 29.75 |
| Total Cash | 1,000.1 | 1,831.9 | 1,212.8 | 1,204.0 | 1,232.4 | 629.3 | 700.9 | 780.7 | 869.5 | 968.5 |
| Total Cash, percent | .0 | .0 | .0 | .0 | .0 | .0 | .0 | .0 | .0 | .0 |
| Account Receivables | .0 | .0 | .0 | .0 | .0 | .0 | .0 | .0 | .0 | .0 |
| Account Receivables, % | 0 | 0 | 0 | 0 | 0 | 0 | 0 | 0 | 0 | 0 |
| Inventories | .0 | .0 | .0 | .0 | .0 | .0 | .0 | .0 | .0 | .0 |
| Inventories, % | 0 | 0 | 0 | 0 | 0 | 0 | 0 | 0 | 0 | 0 |
| Accounts Payable | .0 | .0 | .0 | .0 | .0 | .0 | .0 | .0 | .0 | .0 |
| Accounts Payable, % | 0 | 0 | 0 | 0 | 0 | 0 | 0 | 0 | 0 | 0 |
| Capital Expenditure | -5.4 | -3.6 | -3.9 | -6.2 | -3.0 | -6.4 | -7.2 | -8.0 | -8.9 | -9.9 |
| Capital Expenditure, % | -1.42 | -1.02 | -0.96815 | -1.16 | -0.52995 | -1.02 | -1.02 | -1.02 | -1.02 | -1.02 |
| Tax Rate, % | 20.36 | 20.36 | 20.36 | 20.36 | 20.36 | 20.36 | 20.36 | 20.36 | 20.36 | 20.36 |
| EBITAT | 21.0 | 110.3 | 135.5 | 144.8 | 131.3 | 158.1 | 176.1 | 196.1 | 218.4 | 243.3 |
| Depreciation | ||||||||||
| Changes in Account Receivables | ||||||||||
| Changes in Inventories | ||||||||||
| Changes in Accounts Payable | ||||||||||
| Capital Expenditure | ||||||||||
| UFCF | 27.7 | 118.2 | 140.7 | 146.1 | 139.1 | 166.8 | 185.7 | 206.9 | 230.4 | 256.7 |
| WACC, % | 17.43 | 15.48 | 15.36 | 15.44 | 15.3 | 15.8 | 15.8 | 15.8 | 15.8 | 15.8 |
| PV UFCF | ||||||||||
| SUM PV UFCF | 667.1 | |||||||||
| Long Term Growth Rate, % | 2.00 | |||||||||
| Free cash flow (T + 1) | 262 | |||||||||
| Terminal Value | 1,897 | |||||||||
| Present Terminal Value | 911 | |||||||||
| Enterprise Value | 1,578 | |||||||||
| Net Debt | 5 | |||||||||
| Equity Value | 1,572 | |||||||||
| Diluted Shares Outstanding, MM | 39 | |||||||||
| Equity Value Per Share | 40.81 |
What You Will Get
- Editable Excel Template: A fully customizable Excel-based DCF Calculator featuring pre-filled financials for S&T Bancorp, Inc. (STBA).
- Real-World Data: Access to historical data and forward-looking estimates (highlighted in the yellow cells).
- Forecast Flexibility: Adjust forecast assumptions such as revenue growth, EBITDA %, and WACC.
- Automatic Calculations: Instantly visualize the impact of your inputs on S&T Bancorp, Inc.'s (STBA) valuation.
- Professional Tool: Designed for investors, CFOs, consultants, and financial analysts.
- User-Friendly Design: Organized for clarity and ease of use, complete with step-by-step instructions.
Key Features
- Comprehensive STBA Data: Pre-loaded with S&T Bancorp's historical financial metrics and future projections.
- Flexible Input Options: Modify parameters such as loan growth, interest margins, cost of capital, tax rates, and capital investments.
- Adaptive Valuation Framework: Automatically adjusts Net Present Value (NPV) and intrinsic value in response to your inputs.
- Scenario Analysis: Develop various forecasting scenarios to evaluate diverse valuation results.
- Intuitive User Interface: Designed to be straightforward and accessible for both professionals and newcomers.
How It Works
- 1. Download the Template: Obtain and open the Excel file containing S&T Bancorp, Inc.'s (STBA) financial data.
- 2. Adjust Key Inputs: Modify essential parameters such as growth rates, WACC, and capital expenditures.
- 3. Analyze Results in Real-Time: The DCF model automatically computes intrinsic value and NPV based on your inputs.
- 4. Explore Different Scenarios: Evaluate various forecasts to understand potential valuation results.
- 5. Present with Assurance: Share professional valuation analyses to enhance your decision-making process.
Why Choose This Calculator for S&T Bancorp, Inc. (STBA)?
- Precise Information: Utilize real financial data from S&T Bancorp for trustworthy valuation outcomes.
- Flexible Options: Modify essential variables such as growth rates, WACC, and tax rates to align with your forecasts.
- Efficiency Boost: Built-in calculations save you the hassle of starting from the ground up.
- Expert-Level Resource: Tailored for investors, analysts, and financial consultants.
- Easy to Use: User-friendly design and clear, step-by-step guidance make it accessible for everyone.
Who Should Use This Product?
- Investors: Evaluate S&T Bancorp, Inc.'s (STBA) financial health before making investment decisions.
- CFOs and Financial Analysts: Enhance valuation methodologies and assess financial forecasts for S&T Bancorp, Inc. (STBA).
- Startup Founders: Gain insights into how established banks like S&T Bancorp, Inc. (STBA) are valued.
- Consultants: Provide detailed valuation analyses and reports for clients focused on S&T Bancorp, Inc. (STBA).
- Students and Educators: Utilize real-time data from S&T Bancorp, Inc. (STBA) to teach and learn valuation principles.
What the Template Contains
- Historical Data: Includes S&T Bancorp, Inc.'s (STBA) past financials and baseline forecasts.
- DCF and Levered DCF Models: Detailed templates to calculate S&T Bancorp, Inc.'s (STBA) intrinsic value.
- WACC Sheet: Pre-built calculations for Weighted Average Cost of Capital.
- Editable Inputs: Modify key drivers like growth rates, EBITDA %, and CAPEX assumptions.
- Quarterly and Annual Statements: A complete breakdown of S&T Bancorp, Inc.'s (STBA) financials.
- Interactive Dashboard: Visualize valuation results and projections dynamically.
Disclaimer
All information, articles, and product details provided on this website are for general informational and educational purposes only. We do not claim any ownership over, nor do we intend to infringe upon, any trademarks, copyrights, logos, brand names, or other intellectual property mentioned or depicted on this site. Such intellectual property remains the property of its respective owners, and any references here are made solely for identification or informational purposes, without implying any affiliation, endorsement, or partnership.
We make no representations or warranties, express or implied, regarding the accuracy, completeness, or suitability of any content or products presented. Nothing on this website should be construed as legal, tax, investment, financial, medical, or other professional advice. In addition, no part of this site—including articles or product references—constitutes a solicitation, recommendation, endorsement, advertisement, or offer to buy or sell any securities, franchises, or other financial instruments, particularly in jurisdictions where such activity would be unlawful.
All content is of a general nature and may not address the specific circumstances of any individual or entity. It is not a substitute for professional advice or services. Any actions you take based on the information provided here are strictly at your own risk. You accept full responsibility for any decisions or outcomes arising from your use of this website and agree to release us from any liability in connection with your use of, or reliance upon, the content or products found herein.