
|
Valoración DCF de Streamline Health Solutions, Inc. (STRM) |
Completamente Editable: Adáptelo A Sus Necesidades En Excel O Sheets
Diseño Profesional: Plantillas Confiables Y Estándares De La Industria
Predeterminadas Para Un Uso Rápido Y Eficiente
Compatible con MAC / PC, completamente desbloqueado
No Se Necesita Experiencia; Fáciles De Seguir
Streamline Health Solutions, Inc. (STRM) Bundle
¡Evalúe Streamline Health Solutions, Inc. (STRM) Financial Outlook con precisión experta! Esta calculadora DCF (STRM) viene con datos financieros previamente llenos y ofrece flexibilidad total para modificar el crecimiento de los ingresos, WACC, los márgenes y otros supuestos esenciales para alinearse con sus proyecciones.
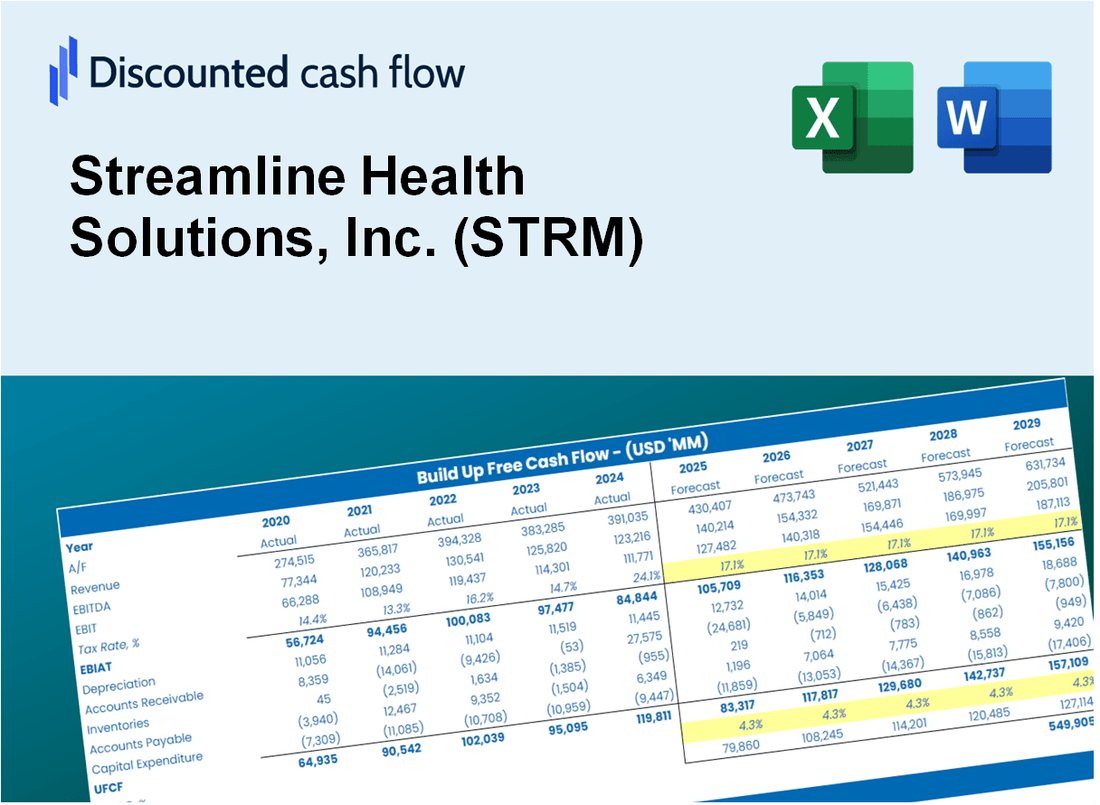
Discounted Cash Flow (DCF) - (USD MM)
| Year | AY1 2020 |
AY2 2021 |
AY3 2022 |
AY4 2023 |
AY5 2024 |
FY1 2025 |
FY2 2026 |
FY3 2027 |
FY4 2028 |
FY5 2029 |
|---|---|---|---|---|---|---|---|---|---|---|
| Revenue | 11.3 | 17.4 | 24.9 | 22.6 | 17.9 | 20.9 | 24.3 | 28.4 | 33.1 | 38.6 |
| Revenue Growth, % | 0 | 53.17 | 43.21 | -9.21 | -20.78 | 16.6 | 16.6 | 16.6 | 16.6 | 16.6 |
| EBITDA | -4.8 | -2.9 | -6.2 | -12.8 | -3.3 | -6.7 | -7.8 | -9.0 | -10.5 | -12.3 |
| EBITDA, % | -42.3 | -16.84 | -25.1 | -56.72 | -18.41 | -31.87 | -31.87 | -31.87 | -31.87 | -31.87 |
| Depreciation | 2.6 | 3.6 | 4.9 | 4.9 | 4.9 | 4.7 | 5.4 | 6.3 | 7.4 | 8.6 |
| Depreciation, % | 22.7 | 20.98 | 19.52 | 21.49 | 27.1 | 22.36 | 22.36 | 22.36 | 22.36 | 22.36 |
| EBIT | -7.4 | -6.6 | -11.1 | -17.7 | -8.1 | -11.3 | -13.2 | -15.4 | -17.9 | -20.9 |
| EBIT, % | -65 | -37.82 | -44.62 | -78.21 | -45.51 | -54.23 | -54.23 | -54.23 | -54.23 | -54.23 |
| Total Cash | 2.4 | 9.9 | 6.6 | 3.2 | 2.2 | 5.5 | 6.4 | 7.4 | 8.7 | 10.1 |
| Total Cash, percent | .0 | .0 | .0 | .0 | .0 | .0 | .0 | .0 | .0 | .0 |
| Account Receivables | 3.1 | 4.7 | 8.7 | 5.0 | 3.2 | 5.4 | 6.3 | 7.3 | 8.5 | 9.9 |
| Account Receivables, % | 27.35 | 26.85 | 34.87 | 22.2 | 17.63 | 25.78 | 25.78 | 25.78 | 25.78 | 25.78 |
| Inventories | 1.4 | .0 | .0 | .0 | .0 | .5 | .6 | .7 | .8 | .9 |
| Inventories, % | 12.22 | 0 | 0 | 0 | 0 | 2.44 | 2.44 | 2.44 | 2.44 | 2.44 |
| Accounts Payable | .3 | .8 | .6 | 1.3 | 1.5 | 1.0 | 1.1 | 1.3 | 1.6 | 1.8 |
| Accounts Payable, % | 2.4 | 4.48 | 2.52 | 5.55 | 8.61 | 4.71 | 4.71 | 4.71 | 4.71 | 4.71 |
| Capital Expenditure | -1.8 | -1.5 | -1.9 | -1.6 | -.9 | -1.9 | -2.2 | -2.5 | -2.9 | -3.4 |
| Capital Expenditure, % | -16.11 | -8.63 | -7.77 | -7.17 | -4.79 | -8.9 | -8.9 | -8.9 | -8.9 | -8.9 |
| Tax Rate, % | 0 | 0 | 0 | 0 | 0 | 0 | 0 | 0 | 0 | 0 |
| EBITAT | -5.8 | -6.7 | -11.2 | -17.6 | -8.1 | -10.8 | -12.6 | -14.7 | -17.2 | -20.0 |
| Depreciation | ||||||||||
| Changes in Account Receivables | ||||||||||
| Changes in Inventories | ||||||||||
| Changes in Accounts Payable | ||||||||||
| Capital Expenditure | ||||||||||
| UFCF | -9.3 | -4.2 | -12.4 | -10.1 | -2.0 | -11.3 | -10.2 | -11.9 | -13.8 | -16.1 |
| WACC, % | 13.07 | 14.28 | 14.28 | 14.27 | 14.28 | 14.04 | 14.04 | 14.04 | 14.04 | 14.04 |
| PV UFCF | ||||||||||
| SUM PV UFCF | -42.3 | |||||||||
| Long Term Growth Rate, % | 2.00 | |||||||||
| Free cash flow (T + 1) | -16 | |||||||||
| Terminal Value | -137 | |||||||||
| Present Terminal Value | -71 | |||||||||
| Enterprise Value | -113 | |||||||||
| Net Debt | 11 | |||||||||
| Equity Value | -124 | |||||||||
| Diluted Shares Outstanding, MM | 4 | |||||||||
| Equity Value Per Share | -30.97 |
What You Will Get
- Real Streamline Data: Preloaded financials – from revenue to EBIT – based on actual and projected figures for Streamline Health Solutions, Inc. (STRM).
- Full Customization: Adjust all critical parameters (yellow cells) like WACC, growth %, and tax rates to fit your analysis needs.
- Instant Valuation Updates: Automatic recalculations to analyze the impact of changes on Streamline Health Solutions, Inc.'s (STRM) fair value.
- Versatile Excel Template: Designed for quick edits, scenario testing, and detailed projections tailored to Streamline Health Solutions, Inc. (STRM).
- Time-Saving and Accurate: Avoid building models from scratch while ensuring precision and flexibility in your financial assessments.
Key Features
- Comprehensive Health Data: Gain access to reliable pre-loaded historical metrics and future forecasts.
- Tailorable Analytics Assumptions: Modify highlighted cells for key variables like growth rates, margins, and operational costs.
- Real-Time Calculations: Instant updates to financial models, including DCF, Net Present Value (NPV), and revenue projections.
- User-Friendly Dashboard: Clear charts and summaries to help visualize your financial insights.
- Designed for All Users: An intuitive layout suitable for investors, healthcare executives, and analysts.
How It Works
- Step 1: Download the prebuilt Excel template featuring Streamline Health Solutions, Inc. (STRM) data.
- Step 2: Navigate through the pre-filled sheets to grasp the essential metrics.
- Step 3: Modify forecasts and assumptions in the editable yellow cells (WACC, growth, margins).
- Step 4: Instantly see the recalculated results, including the intrinsic value of Streamline Health Solutions, Inc. (STRM).
- Step 5: Make well-informed investment decisions or create reports based on the outputs.
Why Choose Streamline Health Solutions, Inc. (STRM) Calculator?
- Accuracy: Utilizes real Streamline Health financials to guarantee precise data.
- Flexibility: Crafted for users to easily adjust and test various inputs.
- Time-Saving: Eliminate the need to create a financial model from the ground up.
- Professional-Grade: Built with the expertise and usability expected at the CFO level.
- User-Friendly: Intuitive design makes it accessible for users without extensive financial modeling skills.
Who Should Use This Product?
- Healthcare Investors: Evaluate Streamline Health Solutions, Inc. (STRM) for informed investment decisions.
- Healthcare Executives: Optimize financial assessments and enhance operational projections.
- Startup Founders in Health Tech: Understand valuation strategies used by established companies like Streamline Health Solutions, Inc. (STRM).
- Consultants: Create comprehensive valuation reports tailored for healthcare clients.
- Students and Educators: Utilize industry-specific data to explore and teach valuation methodologies.
What the Template Contains
- Preloaded STRM Data: Historical and projected financial data, including revenue, EBIT, and capital expenditures.
- DCF and WACC Models: Professional-grade sheets for calculating intrinsic value and Weighted Average Cost of Capital.
- Editable Inputs: Yellow-highlighted cells for adjusting revenue growth, tax rates, and discount rates.
- Financial Statements: Comprehensive annual and quarterly financials for deeper analysis.
- Key Ratios: Profitability, leverage, and efficiency ratios to evaluate performance.
- Dashboard and Charts: Visual summaries of valuation outcomes and assumptions.
Disclaimer
All information, articles, and product details provided on this website are for general informational and educational purposes only. We do not claim any ownership over, nor do we intend to infringe upon, any trademarks, copyrights, logos, brand names, or other intellectual property mentioned or depicted on this site. Such intellectual property remains the property of its respective owners, and any references here are made solely for identification or informational purposes, without implying any affiliation, endorsement, or partnership.
We make no representations or warranties, express or implied, regarding the accuracy, completeness, or suitability of any content or products presented. Nothing on this website should be construed as legal, tax, investment, financial, medical, or other professional advice. In addition, no part of this site—including articles or product references—constitutes a solicitation, recommendation, endorsement, advertisement, or offer to buy or sell any securities, franchises, or other financial instruments, particularly in jurisdictions where such activity would be unlawful.
All content is of a general nature and may not address the specific circumstances of any individual or entity. It is not a substitute for professional advice or services. Any actions you take based on the information provided here are strictly at your own risk. You accept full responsibility for any decisions or outcomes arising from your use of this website and agree to release us from any liability in connection with your use of, or reliance upon, the content or products found herein.