
|
Valoración de DCF Limited Limited (Sundrmfast.ns) |
Completamente Editable: Adáptelo A Sus Necesidades En Excel O Sheets
Diseño Profesional: Plantillas Confiables Y Estándares De La Industria
Predeterminadas Para Un Uso Rápido Y Eficiente
Compatible con MAC / PC, completamente desbloqueado
No Se Necesita Experiencia; Fáciles De Seguir
Sundram Fasteners Limited (SUNDRMFAST.NS) Bundle
¡Evalúe las perspectivas financieras de Sundram Fasteners Limited (Sundrmfastns) como un experto! Esta calculadora DCF (Sundrmfastns) proporciona datos financieros previamente rellenos junto con la flexibilidad para modificar el crecimiento de los ingresos, WACC, los márgenes y otros supuestos esenciales para alinearse con sus proyecciones.
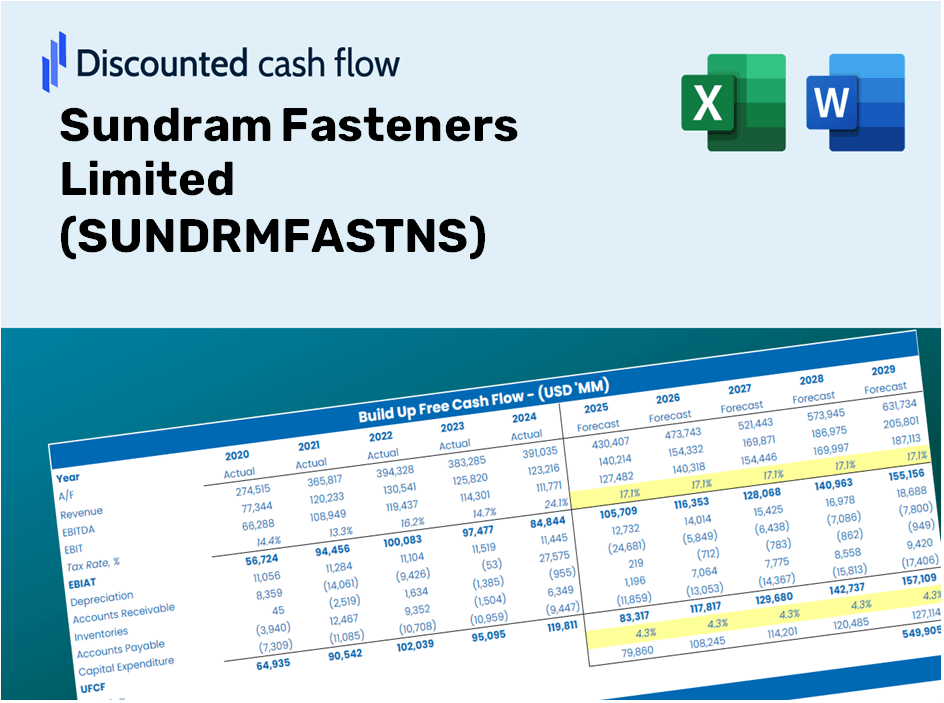
Discounted Cash Flow (DCF) - (USD MM)
| Year | AY1 2021 |
AY2 2022 |
AY3 2023 |
AY4 2024 |
AY5 2025 |
FY1 2026 |
FY2 2027 |
FY3 2028 |
FY4 2029 |
FY5 2030 |
|---|---|---|---|---|---|---|---|---|---|---|
| Revenue | 36,442.9 | 49,020.6 | 56,627.5 | 56,663.1 | 59,554.2 | 67,772.1 | 77,124.1 | 87,766.5 | 99,877.5 | 113,659.6 |
| Revenue Growth, % | 0 | 34.51 | 15.52 | 0.06286698 | 5.1 | 13.8 | 13.8 | 13.8 | 13.8 | 13.8 |
| EBITDA | 6,553.9 | 7,953.1 | 8,474.5 | 8,780.0 | 9,348.8 | 10,893.2 | 12,396.4 | 14,107.0 | 16,053.6 | 18,268.8 |
| EBITDA, % | 17.98 | 16.22 | 14.97 | 15.5 | 15.7 | 16.07 | 16.07 | 16.07 | 16.07 | 16.07 |
| Depreciation | 1,707.4 | 1,811.8 | 1,897.2 | 2,044.4 | 2,145.3 | 2,567.4 | 2,921.7 | 3,324.9 | 3,783.7 | 4,305.8 |
| Depreciation, % | 4.69 | 3.7 | 3.35 | 3.61 | 3.6 | 3.79 | 3.79 | 3.79 | 3.79 | 3.79 |
| EBIT | 4,846.5 | 6,141.3 | 6,577.3 | 6,735.6 | 7,203.5 | 8,325.8 | 9,474.6 | 10,782.1 | 12,269.9 | 13,963.0 |
| EBIT, % | 13.3 | 12.53 | 11.62 | 11.89 | 12.1 | 12.28 | 12.28 | 12.28 | 12.28 | 12.28 |
| Total Cash | 379.5 | 565.7 | 947.7 | 376.4 | 549.3 | 739.5 | 841.5 | 957.6 | 1,089.8 | 1,240.2 |
| Total Cash, percent | .0 | .0 | .0 | .0 | .0 | .0 | .0 | .0 | .0 | .0 |
| Account Receivables | 9,166.0 | 10,497.4 | 11,445.7 | 12,965.6 | 15,098.6 | 15,589.3 | 17,740.5 | 20,188.5 | 22,974.4 | 26,144.6 |
| Account Receivables, % | 25.15 | 21.41 | 20.21 | 22.88 | 25.35 | 23 | 23 | 23 | 23 | 23 |
| Inventories | 6,743.5 | 8,200.8 | 9,234.2 | 9,477.7 | 10,701.9 | 11,688.9 | 13,301.9 | 15,137.4 | 17,226.2 | 19,603.3 |
| Inventories, % | 18.5 | 16.73 | 16.31 | 16.73 | 17.97 | 17.25 | 17.25 | 17.25 | 17.25 | 17.25 |
| Accounts Payable | 5,311.1 | 4,886.2 | 5,411.4 | 5,388.5 | 5,059.2 | 7,062.2 | 8,036.7 | 9,145.7 | 10,407.7 | 11,843.9 |
| Accounts Payable, % | 14.57 | 9.97 | 9.56 | 9.51 | 8.5 | 10.42 | 10.42 | 10.42 | 10.42 | 10.42 |
| Capital Expenditure | -1,949.3 | -2,037.3 | -2,385.3 | -3,995.4 | -3,957.2 | -3,715.7 | -4,228.4 | -4,811.9 | -5,475.9 | -6,231.5 |
| Capital Expenditure, % | -5.35 | -4.16 | -4.21 | -7.05 | -6.64 | -5.48 | -5.48 | -5.48 | -5.48 | -5.48 |
| Tax Rate, % | 24.6 | 24.6 | 24.6 | 24.6 | 24.6 | 24.6 | 24.6 | 24.6 | 24.6 | 24.6 |
| EBITAT | 3,584.0 | 4,515.1 | 4,925.0 | 5,051.9 | 5,431.3 | 6,206.9 | 7,063.4 | 8,038.1 | 9,147.2 | 10,409.5 |
| Depreciation | ||||||||||
| Changes in Account Receivables | ||||||||||
| Changes in Inventories | ||||||||||
| Changes in Accounts Payable | ||||||||||
| Capital Expenditure | ||||||||||
| UFCF | -7,256.3 | 1,076.0 | 2,980.4 | 1,314.6 | -67.1 | 5,583.9 | 2,967.1 | 3,376.5 | 3,842.4 | 4,372.6 |
| WACC, % | 4.59 | 4.59 | 4.59 | 4.59 | 4.59 | 4.59 | 4.59 | 4.59 | 4.59 | 4.59 |
| PV UFCF | ||||||||||
| SUM PV UFCF | 17,708.0 | |||||||||
| Long Term Growth Rate, % | 4.00 | |||||||||
| Free cash flow (T + 1) | 4,548 | |||||||||
| Terminal Value | 773,220 | |||||||||
| Present Terminal Value | 617,861 | |||||||||
| Enterprise Value | 635,569 | |||||||||
| Net Debt | 7,748 | |||||||||
| Equity Value | 627,822 | |||||||||
| Diluted Shares Outstanding, MM | 210 | |||||||||
| Equity Value Per Share | 2,987.81 |
What You Will Receive
- Pre-Filled Financial Model: Utilizes Sundram Fasteners Limited’s actual data for accurate DCF valuation.
- Comprehensive Forecast Control: Modify revenue growth, profit margins, WACC, and other essential variables.
- Real-Time Calculations: Automatic updates let you see outcomes immediately as you make adjustments.
- Professional-Grade Template: A polished Excel file crafted for high-quality valuation purposes.
- Flexible and Reusable: Designed for adaptability, enabling repeated use for in-depth forecasts.
Key Features
- Customizable Forecast Inputs: Adjust essential variables such as revenue growth, EBITDA %, and capital expenditures.
- Instant DCF Valuation: Quickly computes intrinsic value, NPV, and additional financial metrics.
- High-Precision Accuracy: Utilizes Sundram Fasteners Limited's real financial data for credible valuation results.
- Simplified Scenario Analysis: Easily evaluate different scenarios and analyze their outcomes.
- Efficiency Booster: Remove the hassle of constructing intricate valuation models from the ground up.
How It Works
- Step 1: Download the prebuilt Excel template featuring Sundram Fasteners Limited (SUNDRMFASTNS) data.
- Step 2: Navigate through the pre-filled sheets to familiarize yourself with the key metrics.
- Step 3: Adjust forecasts and assumptions in the editable yellow cells (WACC, growth, margins).
- Step 4: Instantly see the recalculated results, including Sundram Fasteners Limited's intrinsic value.
- Step 5: Utilize the outputs to make informed investment decisions or generate detailed reports.
Why Choose This Calculator for Sundram Fasteners Limited (SUNDRMFASTNS)?
- Accuracy: Leveraging real financial data for precise calculations.
- Flexibility: Allows users to easily customize and test inputs as needed.
- Time-Saving: Eliminate the complexity of creating a DCF model from the ground up.
- Professional-Grade: Crafted with the expertise and attention to detail expected at the CFO level.
- User-Friendly: Intuitive interface designed for users of all skill levels, including those new to financial modeling.
Who Can Benefit from This Product?
- Investors: Accurately assess the fair value of Sundram Fasteners Limited (SUNDRMFASTNS) before making investment choices.
- CFOs: Utilize a professional-grade DCF model for comprehensive financial reporting and analysis.
- Consultants: Efficiently customize the template for client valuation reports.
- Entrepreneurs: Discover financial modeling techniques employed by leading corporations.
- Educators: Use this resource as an educational tool to showcase valuation strategies.
Contents of the Template
- Preloaded SUNDRMFASTNS Data: Historical and projected financial metrics, including revenue, EBIT, and capital expenditures.
- DCF and WACC Models: High-quality templates for calculating intrinsic value and Weighted Average Cost of Capital.
- Editable Inputs: Cells highlighted in yellow for modifying revenue growth, tax rates, and discount rates.
- Financial Statements: Detailed annual and quarterly financial statements for in-depth analysis.
- Key Ratios: Ratios assessing profitability, leverage, and efficiency to analyze performance.
- Dashboard and Charts: Visual representations of valuation results and underlying assumptions.
Disclaimer
All information, articles, and product details provided on this website are for general informational and educational purposes only. We do not claim any ownership over, nor do we intend to infringe upon, any trademarks, copyrights, logos, brand names, or other intellectual property mentioned or depicted on this site. Such intellectual property remains the property of its respective owners, and any references here are made solely for identification or informational purposes, without implying any affiliation, endorsement, or partnership.
We make no representations or warranties, express or implied, regarding the accuracy, completeness, or suitability of any content or products presented. Nothing on this website should be construed as legal, tax, investment, financial, medical, or other professional advice. In addition, no part of this site—including articles or product references—constitutes a solicitation, recommendation, endorsement, advertisement, or offer to buy or sell any securities, franchises, or other financial instruments, particularly in jurisdictions where such activity would be unlawful.
All content is of a general nature and may not address the specific circumstances of any individual or entity. It is not a substitute for professional advice or services. Any actions you take based on the information provided here are strictly at your own risk. You accept full responsibility for any decisions or outcomes arising from your use of this website and agree to release us from any liability in connection with your use of, or reliance upon, the content or products found herein.