
|
Valoración DCF de Silvercorp Metals Inc. (SVM) |
Completamente Editable: Adáptelo A Sus Necesidades En Excel O Sheets
Diseño Profesional: Plantillas Confiables Y Estándares De La Industria
Predeterminadas Para Un Uso Rápido Y Eficiente
Compatible con MAC / PC, completamente desbloqueado
No Se Necesita Experiencia; Fáciles De Seguir
Silvercorp Metals Inc. (SVM) Bundle
¡Descubra el verdadero valor de SilverCorp Metals Inc. (SVM) con nuestra calculadora DCF avanzada! Ajuste los supuestos clave, explore varios escenarios y evalúe el impacto de los cambios en la valoración de SilverCorp, todo dentro de una plantilla de Excel fácil de usar.
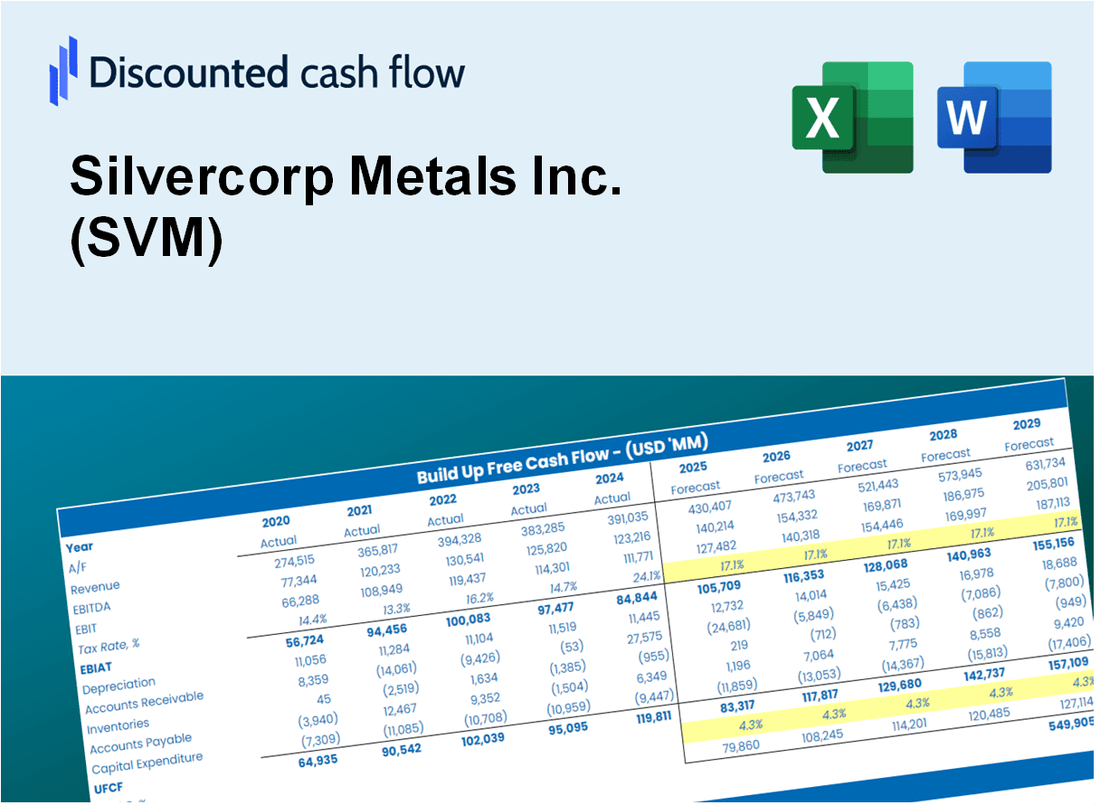
Discounted Cash Flow (DCF) - (USD MM)
| Year | AY1 2020 |
AY2 2021 |
AY3 2022 |
AY4 2023 |
AY5 2024 |
FY1 2025 |
FY2 2026 |
FY3 2027 |
FY4 2028 |
FY5 2029 |
|---|---|---|---|---|---|---|---|---|---|---|
| Revenue | 192.1 | 217.9 | 208.1 | 215.2 | 298.9 | 337.2 | 380.4 | 429.1 | 484.1 | 546.1 |
| Revenue Growth, % | 0 | 13.44 | -4.49 | 3.39 | 38.9 | 12.81 | 12.81 | 12.81 | 12.81 | 12.81 |
| EBITDA | 97.1 | 84.4 | 64.8 | 99.1 | 142.8 | 144.5 | 163.0 | 183.9 | 207.4 | 234.0 |
| EBITDA, % | 50.53 | 38.75 | 31.13 | 46.07 | 47.76 | 42.85 | 42.85 | 42.85 | 42.85 | 42.85 |
| Depreciation | 23.2 | 27.0 | 29.4 | 29.0 | 32.8 | 42.5 | 48.0 | 54.1 | 61.0 | 68.9 |
| Depreciation, % | 12.09 | 12.4 | 14.11 | 13.46 | 10.98 | 12.61 | 12.61 | 12.61 | 12.61 | 12.61 |
| EBIT | 73.8 | 57.4 | 35.4 | 70.2 | 109.9 | 102.0 | 115.0 | 129.8 | 146.4 | 165.1 |
| EBIT, % | 38.44 | 26.35 | 17.02 | 32.61 | 36.78 | 30.24 | 30.24 | 30.24 | 30.24 | 30.24 |
| Total Cash | 199.1 | 212.9 | 203.3 | 184.9 | 369.1 | 324.6 | 366.2 | 413.1 | 466.0 | 525.7 |
| Total Cash, percent | .0 | .0 | .0 | .0 | .0 | .0 | .0 | .0 | .0 | .0 |
| Account Receivables | 7.5 | 4.8 | 2.5 | 2.9 | 2.3 | 6.3 | 7.1 | 8.1 | 9.1 | 10.3 |
| Account Receivables, % | 3.92 | 2.2 | 1.19 | 1.33 | 0.76147 | 1.88 | 1.88 | 1.88 | 1.88 | 1.88 |
| Inventories | 9.8 | 9.1 | 8.3 | 7.4 | 8.0 | 13.1 | 14.8 | 16.7 | 18.8 | 21.2 |
| Inventories, % | 5.08 | 4.19 | 4.01 | 3.44 | 2.69 | 3.88 | 3.88 | 3.88 | 3.88 | 3.88 |
| Accounts Payable | 30.3 | 39.7 | 36.7 | 41.8 | 63.9 | 62.3 | 70.3 | 79.3 | 89.5 | 100.9 |
| Accounts Payable, % | 15.77 | 18.2 | 17.65 | 19.42 | 21.37 | 18.48 | 18.48 | 18.48 | 18.48 | 18.48 |
| Capital Expenditure | -52.2 | -67.2 | -55.0 | -63.5 | -86.0 | -96.2 | -108.6 | -122.5 | -138.1 | -155.8 |
| Capital Expenditure, % | -27.17 | -30.84 | -26.41 | -29.49 | -28.78 | -28.54 | -28.54 | -28.54 | -28.54 | -28.54 |
| Tax Rate, % | 44.56 | 44.56 | 44.56 | 44.56 | 44.56 | 44.56 | 44.56 | 44.56 | 44.56 | 44.56 |
| EBITAT | 46.6 | 30.8 | 20.8 | 36.4 | 60.9 | 57.7 | 65.0 | 73.4 | 82.8 | 93.4 |
| Depreciation | ||||||||||
| Changes in Account Receivables | ||||||||||
| Changes in Inventories | ||||||||||
| Changes in Accounts Payable | ||||||||||
| Capital Expenditure | ||||||||||
| UFCF | 30.6 | 3.4 | -4.6 | 7.5 | 29.8 | -6.7 | 10.0 | 11.2 | 12.7 | 14.3 |
| WACC, % | 10.06 | 10.02 | 10.04 | 10.01 | 10.02 | 10.03 | 10.03 | 10.03 | 10.03 | 10.03 |
| PV UFCF | ||||||||||
| SUM PV UFCF | 28.0 | |||||||||
| Long Term Growth Rate, % | 2.00 | |||||||||
| Free cash flow (T + 1) | 15 | |||||||||
| Terminal Value | 182 | |||||||||
| Present Terminal Value | 113 | |||||||||
| Enterprise Value | 141 | |||||||||
| Net Debt | -252 | |||||||||
| Equity Value | 393 | |||||||||
| Diluted Shares Outstanding, MM | 206 | |||||||||
| Equity Value Per Share | 1.90 |
What You Will Get
- Real SVM Financial Data: Pre-filled with Silvercorp Metals Inc.'s historical and projected data for precise analysis.
- Fully Editable Template: Modify key inputs like revenue growth, WACC, and EBITDA % with ease.
- Automatic Calculations: See Silvercorp Metals Inc.'s intrinsic value update instantly based on your changes.
- Professional Valuation Tool: Designed for investors, analysts, and consultants seeking accurate DCF results.
- User-Friendly Design: Simple structure and clear instructions for all experience levels.
Key Features
- Comprehensive Data: Silvercorp Metals Inc.'s (SVM) historical financials and pre-populated projections.
- Customizable Parameters: Adjust WACC, tax rates, revenue growth, and EBITDA margins as needed.
- Real-Time Insights: Instantly view the recalculated intrinsic value of Silvercorp Metals Inc. (SVM).
- Visual Representation: Dashboard graphs illustrate valuation outcomes and essential metrics.
- Designed for Precision: A reliable resource for analysts, investors, and finance professionals.
How It Works
- Step 1: Download the Excel file for Silvercorp Metals Inc. (SVM).
- Step 2: Review Silvercorp’s pre-filled financial data and projections.
- Step 3: Adjust key inputs such as ore production, operating costs, and tax rates (highlighted cells).
- Step 4: Observe the DCF model refresh in real-time as you modify your assumptions.
- Step 5: Evaluate the outputs and leverage the findings for your investment strategies.
Why Choose This Calculator for Silvercorp Metals Inc. (SVM)?
- Accurate Data: Real Silvercorp financials provide trustworthy valuation outcomes.
- Customizable: Modify essential parameters such as growth rates, WACC, and tax rates to align with your forecasts.
- Time-Saving: Pre-built calculations save you from having to start from the beginning.
- Professional-Grade Tool: Tailored for investors, analysts, and consultants in the mining sector.
- User-Friendly: Easy-to-navigate layout and clear instructions ensure accessibility for all users.
Who Should Use This Product?
- Investors: Accurately assess Silvercorp Metals Inc.'s (SVM) fair value prior to making investment choices.
- CFOs: Utilize a professional-grade DCF model for financial reporting and analysis specific to Silvercorp Metals Inc. (SVM).
- Consultants: Efficiently modify the template for valuation reports tailored to clients interested in Silvercorp Metals Inc. (SVM).
- Entrepreneurs: Acquire insights into the financial modeling practices used by leading mining companies, including Silvercorp Metals Inc. (SVM).
- Educators: Employ it as an educational resource to illustrate valuation methodologies relevant to Silvercorp Metals Inc. (SVM).
What the Template Contains
- Operating and Balance Sheet Data: Pre-filled Silvercorp Metals Inc. (SVM) historical data and forecasts, including revenue, EBITDA, EBIT, and capital expenditures.
- WACC Calculation: A dedicated sheet for Weighted Average Cost of Capital (WACC), including parameters like Beta, risk-free rate, and share price.
- DCF Valuation (Unlevered and Levered): Editable Discounted Cash Flow models showing intrinsic value with detailed calculations.
- Financial Statements: Pre-loaded financial statements (annual and quarterly) to support analysis.
- Key Ratios: Includes profitability, leverage, and efficiency ratios for Silvercorp Metals Inc. (SVM).
- Dashboard and Charts: Visual summary of valuation outputs and assumptions to analyze results easily.
Disclaimer
All information, articles, and product details provided on this website are for general informational and educational purposes only. We do not claim any ownership over, nor do we intend to infringe upon, any trademarks, copyrights, logos, brand names, or other intellectual property mentioned or depicted on this site. Such intellectual property remains the property of its respective owners, and any references here are made solely for identification or informational purposes, without implying any affiliation, endorsement, or partnership.
We make no representations or warranties, express or implied, regarding the accuracy, completeness, or suitability of any content or products presented. Nothing on this website should be construed as legal, tax, investment, financial, medical, or other professional advice. In addition, no part of this site—including articles or product references—constitutes a solicitation, recommendation, endorsement, advertisement, or offer to buy or sell any securities, franchises, or other financial instruments, particularly in jurisdictions where such activity would be unlawful.
All content is of a general nature and may not address the specific circumstances of any individual or entity. It is not a substitute for professional advice or services. Any actions you take based on the information provided here are strictly at your own risk. You accept full responsibility for any decisions or outcomes arising from your use of this website and agree to release us from any liability in connection with your use of, or reliance upon, the content or products found herein.