
|
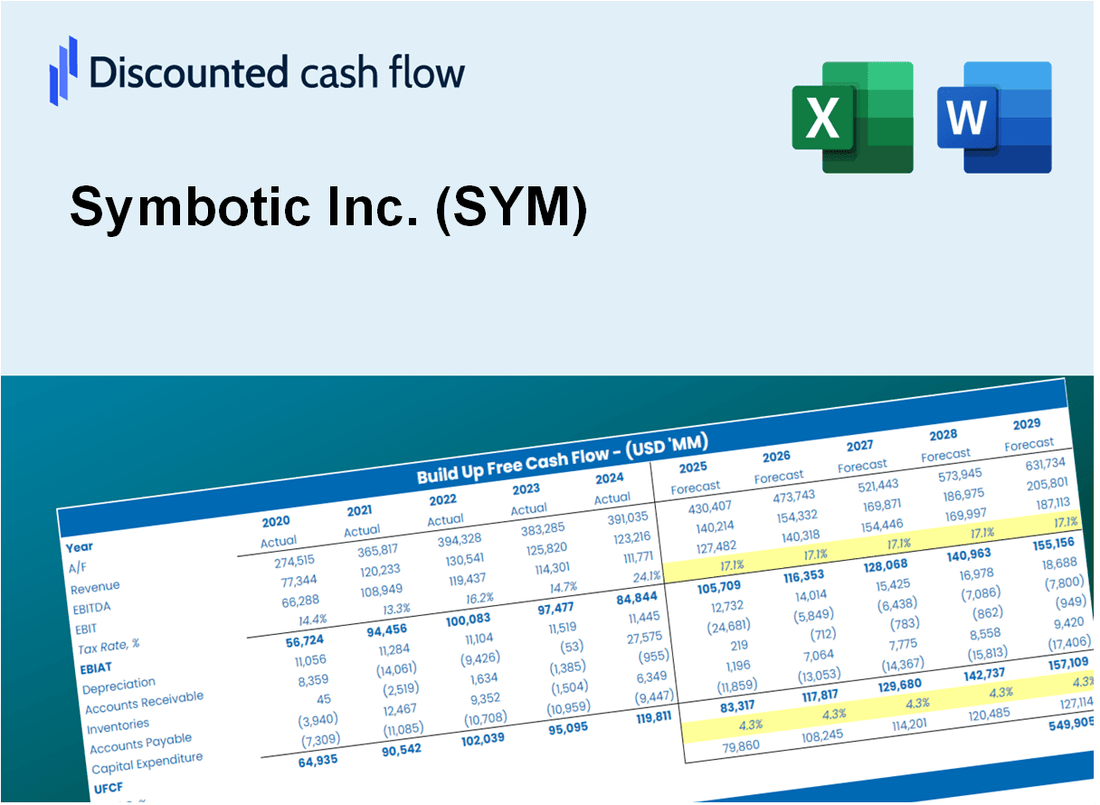
Valoración DCF de Symbotic Inc. (SYM) |
Completamente Editable: Adáptelo A Sus Necesidades En Excel O Sheets
Diseño Profesional: Plantillas Confiables Y Estándares De La Industria
Predeterminadas Para Un Uso Rápido Y Eficiente
Compatible con MAC / PC, completamente desbloqueado
No Se Necesita Experiencia; Fáciles De Seguir
Symbotic Inc. (SYM) Bundle
¿Busca determinar el valor intrínseco de Symbotic Inc.? Nuestra calculadora SYM DCF integra datos del mundo real con extensas características de personalización, lo que le permite refinar sus proyecciones y mejorar sus estrategias de inversión.
Discounted Cash Flow (DCF) - (USD MM)
| Year | AY1 2020 |
AY2 2021 |
AY3 2022 |
AY4 2023 |
AY5 2024 |
FY1 2025 |
FY2 2026 |
FY3 2027 |
FY4 2028 |
FY5 2029 |
|---|---|---|---|---|---|---|---|---|---|---|
| Revenue | 92.1 | 251.9 | 593.3 | 1,176.9 | 1,788.2 | 3,354.2 | 6,291.6 | 11,801.5 | 22,136.6 | 41,522.8 |
| Revenue Growth, % | 0 | 173.56 | 135.52 | 98.36 | 51.94 | 87.58 | 87.58 | 87.58 | 87.58 | 87.58 |
| EBITDA | -104.6 | -117.9 | -134.4 | -189.9 | -60.1 | -1,267.5 | -2,377.5 | -4,459.5 | -8,365.0 | -15,690.6 |
| EBITDA, % | -113.64 | -46.8 | -22.65 | -16.13 | -3.36 | -37.79 | -37.79 | -37.79 | -37.79 | -37.79 |
| Depreciation | 5.7 | 4.5 | 6.0 | 11.3 | 23.2 | 75.7 | 141.9 | 266.2 | 499.4 | 936.7 |
| Depreciation, % | 6.23 | 1.78 | 1.01 | 0.96109 | 1.3 | 2.26 | 2.26 | 2.26 | 2.26 | 2.26 |
| EBIT | -110.4 | -122.4 | -140.4 | -201.2 | -83.3 | -1,301.4 | -2,441.0 | -4,578.8 | -8,588.6 | -16,110.1 |
| EBIT, % | -119.86 | -48.58 | -23.66 | -17.09 | -4.66 | -38.8 | -38.8 | -38.8 | -38.8 | -38.8 |
| Total Cash | 58.3 | 156.6 | 353.5 | 545.5 | 727.3 | 1,825.0 | 3,423.2 | 6,421.1 | 12,044.4 | 22,592.4 |
| Total Cash, percent | .0 | .0 | .0 | .0 | .0 | .0 | .0 | .0 | .0 | .0 |
| Account Receivables | 2.5 | 63.4 | 105.2 | 190.4 | 419.8 | 571.8 | 1,072.6 | 2,012.0 | 3,774.0 | 7,079.1 |
| Account Receivables, % | 2.7 | 25.16 | 17.74 | 16.17 | 23.48 | 17.05 | 17.05 | 17.05 | 17.05 | 17.05 |
| Inventories | 16.5 | 33.6 | 91.9 | 136.1 | 106.1 | 430.6 | 807.6 | 1,514.9 | 2,841.5 | 5,330.0 |
| Inventories, % | 17.87 | 13.32 | 15.49 | 11.57 | 5.94 | 12.84 | 12.84 | 12.84 | 12.84 | 12.84 |
| Accounts Payable | 6.0 | 28.0 | 68.4 | 109.9 | 175.2 | 323.8 | 607.4 | 1,139.3 | 2,137.1 | 4,008.6 |
| Accounts Payable, % | 6.47 | 11.12 | 11.54 | 9.34 | 9.8 | 9.65 | 9.65 | 9.65 | 9.65 | 9.65 |
| Capital Expenditure | -5.1 | -12.2 | -18.0 | -21.3 | -44.4 | -118.4 | -222.2 | -416.7 | -781.7 | -1,466.3 |
| Capital Expenditure, % | -5.51 | -4.83 | -3.03 | -1.81 | -2.48 | -3.53 | -3.53 | -3.53 | -3.53 | -3.53 |
| Tax Rate, % | 83.23 | 83.23 | 83.23 | 83.23 | 83.23 | 83.23 | 83.23 | 83.23 | 83.23 | 83.23 |
| EBITAT | -110.3 | -122.4 | -79.7 | -22.6 | -14.0 | -741.1 | -1,390.2 | -2,607.6 | -4,891.2 | -9,174.7 |
| Depreciation | ||||||||||
| Changes in Account Receivables | ||||||||||
| Changes in Inventories | ||||||||||
| Changes in Accounts Payable | ||||||||||
| Capital Expenditure | ||||||||||
| UFCF | -122.6 | -186.0 | -151.5 | -120.5 | -169.3 | -1,111.8 | -2,064.7 | -3,872.8 | -7,264.5 | -13,626.3 |
| WACC, % | 13.7 | 13.7 | 13.7 | 13.7 | 13.7 | 13.7 | 13.7 | 13.7 | 13.7 | 13.7 |
| PV UFCF | ||||||||||
| SUM PV UFCF | -16,727.8 | |||||||||
| Long Term Growth Rate, % | 2.00 | |||||||||
| Free cash flow (T + 1) | -13,899 | |||||||||
| Terminal Value | -118,802 | |||||||||
| Present Terminal Value | -62,522 | |||||||||
| Enterprise Value | -79,250 | |||||||||
| Net Debt | -727 | |||||||||
| Equity Value | -78,523 | |||||||||
| Diluted Shares Outstanding, MM | 96 | |||||||||
| Equity Value Per Share | -820.53 |
What You Will Get
- Real SYM Financial Data: Pre-filled with Symbotic Inc.’s historical and projected data for precise analysis.
- Fully Editable Template: Modify key inputs like revenue growth, WACC, and EBITDA % with ease.
- Automatic Calculations: See Symbotic Inc.’s intrinsic value update instantly based on your changes.
- Professional Valuation Tool: Designed for investors, analysts, and consultants seeking accurate DCF results.
- User-Friendly Design: Simple structure and clear instructions for all experience levels.
Key Features
- Comprehensive Data: Symbotic Inc.'s historical financial reports and pre-filled projections.
- Customizable Parameters: Adjust inputs such as WACC, tax rates, revenue growth, and EBITDA margins.
- Real-Time Calculations: Observe Symbotic Inc.'s intrinsic value update instantly.
- Intuitive Visualizations: Dashboard graphs present valuation outcomes and essential metrics.
- Designed for Precision: A reliable tool tailored for analysts, investors, and finance professionals.
How It Works
- Download the Template: Gain immediate access to the Excel-based SYM DCF Calculator.
- Input Your Assumptions: Modify the yellow-highlighted cells for growth rates, WACC, margins, and other variables.
- Instant Calculations: The model automatically recalculates Symbotic Inc.’s intrinsic value.
- Test Scenarios: Experiment with various assumptions to assess potential changes in valuation.
- Analyze and Decide: Utilize the outcomes to inform your investment or financial strategies.
Why Choose Symbotic Inc. (SYM)?
- Streamline Operations: Enhance efficiency with automated solutions tailored for your needs.
- Boost Productivity: Advanced technology minimizes downtime and maximizes throughput.
- Highly Scalable: Adaptable systems designed to grow with your business requirements.
- User-Friendly Interface: Intuitive design ensures ease of use for all team members.
- Industry Leader: Renowned for innovation and reliability in warehouse automation.
Who Should Use This Product?
- Individual Investors: Make informed decisions about buying or selling Symbotic Inc. (SYM) stock.
- Financial Analysts: Streamline valuation processes with ready-to-use financial models specific to Symbotic Inc. (SYM).
- Consultants: Deliver professional valuation insights on Symbotic Inc. (SYM) to clients quickly and accurately.
- Business Owners: Understand how innovative companies like Symbotic Inc. (SYM) are valued to guide your own strategy.
- Finance Students: Learn valuation techniques using real-world data and scenarios related to Symbotic Inc. (SYM).
What the Template Contains
- Operating and Balance Sheet Data: Pre-filled Symbotic Inc. (SYM) historical data and forecasts, including revenue, EBITDA, EBIT, and capital expenditures.
- WACC Calculation: A dedicated sheet for Weighted Average Cost of Capital (WACC), including parameters like Beta, risk-free rate, and share price.
- DCF Valuation (Unlevered and Levered): Editable Discounted Cash Flow models showing intrinsic value with detailed calculations.
- Financial Statements: Pre-loaded financial statements (annual and quarterly) to support analysis.
- Key Ratios: Includes profitability, leverage, and efficiency ratios for Symbotic Inc. (SYM).
- Dashboard and Charts: Visual summary of valuation outputs and assumptions to analyze results easily.
Disclaimer
All information, articles, and product details provided on this website are for general informational and educational purposes only. We do not claim any ownership over, nor do we intend to infringe upon, any trademarks, copyrights, logos, brand names, or other intellectual property mentioned or depicted on this site. Such intellectual property remains the property of its respective owners, and any references here are made solely for identification or informational purposes, without implying any affiliation, endorsement, or partnership.
We make no representations or warranties, express or implied, regarding the accuracy, completeness, or suitability of any content or products presented. Nothing on this website should be construed as legal, tax, investment, financial, medical, or other professional advice. In addition, no part of this site—including articles or product references—constitutes a solicitation, recommendation, endorsement, advertisement, or offer to buy or sell any securities, franchises, or other financial instruments, particularly in jurisdictions where such activity would be unlawful.
All content is of a general nature and may not address the specific circumstances of any individual or entity. It is not a substitute for professional advice or services. Any actions you take based on the information provided here are strictly at your own risk. You accept full responsibility for any decisions or outcomes arising from your use of this website and agree to release us from any liability in connection with your use of, or reliance upon, the content or products found herein.