
|
Valoración de DCF Symphony Limited (Symphony.NS) |
Completamente Editable: Adáptelo A Sus Necesidades En Excel O Sheets
Diseño Profesional: Plantillas Confiables Y Estándares De La Industria
Predeterminadas Para Un Uso Rápido Y Eficiente
Compatible con MAC / PC, completamente desbloqueado
No Se Necesita Experiencia; Fáciles De Seguir
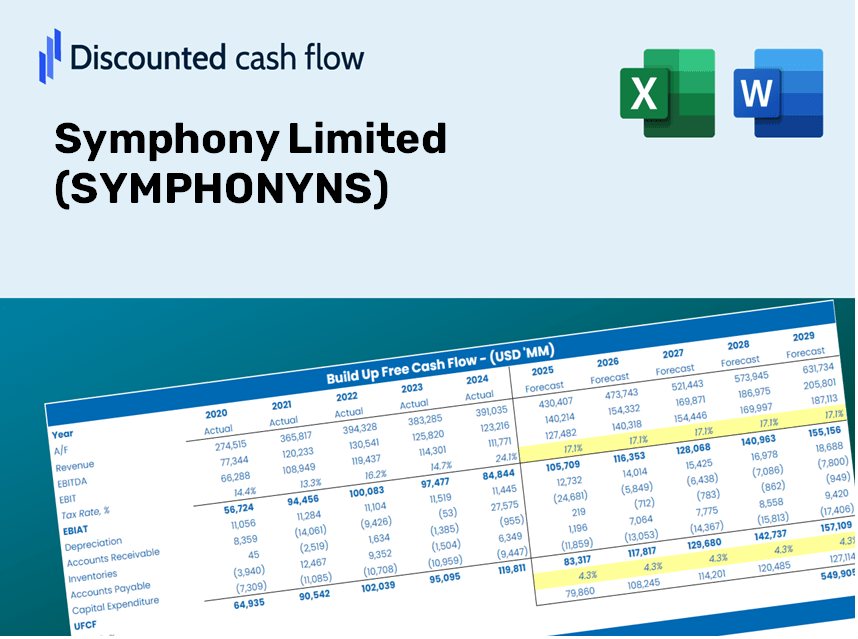
Symphony Limited (SYMPHONY.NS) Bundle
¡Evalúe las perspectivas financieras de Symphony Limited como un experto! Esta calculadora DCF (Symphonyns) proporciona datos financieros precipidos y ofrece una flexibilidad total para modificar el crecimiento de los ingresos, WACC, los márgenes y otros supuestos críticos para alinearse con sus proyecciones.
Discounted Cash Flow (DCF) - (USD MM)
| Year | AY1 2021 |
AY2 2022 |
AY3 2023 |
AY4 2024 |
AY5 2025 |
FY1 2026 |
FY2 2027 |
FY3 2028 |
FY4 2029 |
FY5 2030 |
|---|---|---|---|---|---|---|---|---|---|---|
| Revenue | 8,972.8 | 10,349.2 | 11,880.0 | 11,560.7 | 15,760.0 | 18,272.4 | 21,185.4 | 24,562.7 | 28,478.5 | 33,018.5 |
| Revenue Growth, % | 0 | 15.34 | 14.79 | -2.69 | 36.32 | 15.94 | 15.94 | 15.94 | 15.94 | 15.94 |
| EBITDA | 1,646.1 | 2,020.5 | 1,900.3 | 2,187.6 | 3,110.0 | 3,381.2 | 3,920.2 | 4,545.1 | 5,269.7 | 6,109.8 |
| EBITDA, % | 18.35 | 19.52 | 16 | 18.92 | 19.73 | 18.5 | 18.5 | 18.5 | 18.5 | 18.5 |
| Depreciation | 214.2 | 241.8 | 264.5 | 258.3 | 220.0 | 386.7 | 448.3 | 519.8 | 602.6 | 698.7 |
| Depreciation, % | 2.39 | 2.34 | 2.23 | 2.23 | 1.4 | 2.12 | 2.12 | 2.12 | 2.12 | 2.12 |
| EBIT | 1,431.9 | 1,778.7 | 1,635.8 | 1,929.3 | 2,890.0 | 2,994.5 | 3,471.9 | 4,025.4 | 4,667.1 | 5,411.1 |
| EBIT, % | 15.96 | 17.19 | 13.77 | 16.69 | 18.34 | 16.39 | 16.39 | 16.39 | 16.39 | 16.39 |
| Total Cash | 3,593.7 | 3,232.7 | 2,800.0 | 1,767.3 | 1,920.0 | 4,470.4 | 5,183.1 | 6,009.3 | 6,967.3 | 8,078.1 |
| Total Cash, percent | .0 | .0 | .0 | .0 | .0 | .0 | .0 | .0 | .0 | .0 |
| Account Receivables | 1,673.0 | 2,095.7 | 1,156.1 | 1,684.0 | 1,420.5 | 2,638.8 | 3,059.4 | 3,547.2 | 4,112.7 | 4,768.3 |
| Account Receivables, % | 18.65 | 20.25 | 9.73 | 14.57 | 9.01 | 14.44 | 14.44 | 14.44 | 14.44 | 14.44 |
| Inventories | 1,465.6 | 2,049.6 | 3,041.4 | 2,465.9 | 2,840.0 | 3,694.3 | 4,283.2 | 4,966.1 | 5,757.8 | 6,675.7 |
| Inventories, % | 16.33 | 19.8 | 25.6 | 21.33 | 18.02 | 20.22 | 20.22 | 20.22 | 20.22 | 20.22 |
| Accounts Payable | 1,357.4 | 1,493.6 | 1,655.3 | 1,488.6 | 1,790.0 | 2,475.1 | 2,869.7 | 3,327.2 | 3,857.6 | 4,472.5 |
| Accounts Payable, % | 15.13 | 14.43 | 13.93 | 12.88 | 11.36 | 13.55 | 13.55 | 13.55 | 13.55 | 13.55 |
| Capital Expenditure | -196.7 | -92.5 | -110.0 | -79.3 | -230.0 | -225.0 | -260.9 | -302.5 | -350.7 | -406.6 |
| Capital Expenditure, % | -2.19 | -0.89379 | -0.92593 | -0.68594 | -1.46 | -1.23 | -1.23 | -1.23 | -1.23 | -1.23 |
| Tax Rate, % | 23.93 | 23.93 | 23.93 | 23.93 | 23.93 | 23.93 | 23.93 | 23.93 | 23.93 | 23.93 |
| EBITAT | 1,172.0 | 1,277.4 | 1,252.9 | 1,579.4 | 2,198.5 | 2,324.9 | 2,695.5 | 3,125.3 | 3,623.5 | 4,201.1 |
| Depreciation | ||||||||||
| Changes in Account Receivables | ||||||||||
| Changes in Inventories | ||||||||||
| Changes in Accounts Payable | ||||||||||
| Capital Expenditure | ||||||||||
| UFCF | -591.7 | 556.2 | 1,516.9 | 1,639.3 | 2,379.3 | 1,099.1 | 2,267.9 | 2,629.5 | 3,048.6 | 3,534.7 |
| WACC, % | 4.96 | 4.95 | 4.95 | 4.96 | 4.95 | 4.96 | 4.96 | 4.96 | 4.96 | 4.96 |
| PV UFCF | ||||||||||
| SUM PV UFCF | 10,668.0 | |||||||||
| Long Term Growth Rate, % | 4.00 | |||||||||
| Free cash flow (T + 1) | 3,676 | |||||||||
| Terminal Value | 384,708 | |||||||||
| Present Terminal Value | 302,068 | |||||||||
| Enterprise Value | 312,736 | |||||||||
| Net Debt | 1,050 | |||||||||
| Equity Value | 311,686 | |||||||||
| Diluted Shares Outstanding, MM | 69 | |||||||||
| Equity Value Per Share | 4,520.20 |
What You Will Receive
- Authentic Symphony Data: Comprehensive financials – covering everything from revenue to EBIT – derived from actual and forecasted figures.
- Complete Customization: Modify all essential parameters (highlighted cells) such as WACC, growth %, and tax rates.
- Real-Time Valuation Adjustments: Automatic recalibrations to evaluate the effects of changes on Symphony's fair value.
- Flexible Excel Template: Designed for easy modifications, scenario testing, and thorough projections.
- Efficient and Precise: Bypass the hassle of building models from the ground up while ensuring accuracy and adaptability.
Core Features
- Genuine Symphony Financial Data: Access reliable pre-loaded historical figures and future forecasts.
- Adjustable Forecast Assumptions: Modify highlighted cells for parameters like WACC, growth rates, and margins.
- Real-Time Calculations: Automatic updates to DCF, Net Present Value (NPV), and cash flow assessments.
- User-Friendly Dashboard: Clear and concise charts and summaries to help you visualize your valuation outcomes.
- Suitable for All Users: A straightforward and intuitive layout designed for investors, CFOs, and consultants alike.
How It Operates
- Step 1: Download the Excel spreadsheet.
- Step 2: Examine the pre-filled data for Symphony Limited (SYMPHONYNS), including both historical and projected figures.
- Step 3: Modify key assumptions (highlighted in yellow) to reflect your analysis.
- Step 4: Observe the automatic updates for Symphony Limited’s (SYMPHONYNS) intrinsic value.
- Step 5: Utilize the results for your investment strategies or reporting purposes.
Why Opt for the Symphony Limited Calculator?
- Precision: Utilizes authentic Symphony Limited (SYMPHONYNS) financials for precise data.
- Versatility: Engineered to allow users to explore and alter inputs as needed.
- Efficiency: Eliminate the complexities of creating a DCF model from the ground up.
- Expert-Level: Crafted with the accuracy and functionality expected by CFOs.
- Intuitive: Simple to navigate, suitable for users with various levels of financial modeling expertise.
Who Can Benefit from Symphony Limited (SYMPHONYNS)?
- Professional Investors: Develop thorough and trustworthy valuation models for investment assessments.
- Corporate Finance Teams: Evaluate valuation scenarios to shape strategic decisions.
- Consultants and Advisors: Deliver precise valuation insights for clients interested in Symphony Limited (SYMPHONYNS).
- Students and Educators: Utilize real-world data for practical applications in financial modeling education.
- Tech Enthusiasts: Gain insights into how technology companies like Symphony Limited (SYMPHONYNS) are appraised in the financial market.
What the Template Includes
- Preloaded SYMPHONYNS Data: Historical and forecasted financial figures, encompassing revenue, EBIT, and capital expenditures.
- DCF and WACC Models: Advanced spreadsheets for determining intrinsic value and Weighted Average Cost of Capital.
- Editable Inputs: Cells highlighted in yellow for customizing revenue growth, tax rates, and discount rates.
- Financial Statements: Detailed annual and quarterly financial reports for a comprehensive analysis.
- Key Ratios: Metrics for profitability, leverage, and efficiency to assess performance.
- Dashboard and Charts: Visual representations of valuation results and underlying assumptions.
Disclaimer
All information, articles, and product details provided on this website are for general informational and educational purposes only. We do not claim any ownership over, nor do we intend to infringe upon, any trademarks, copyrights, logos, brand names, or other intellectual property mentioned or depicted on this site. Such intellectual property remains the property of its respective owners, and any references here are made solely for identification or informational purposes, without implying any affiliation, endorsement, or partnership.
We make no representations or warranties, express or implied, regarding the accuracy, completeness, or suitability of any content or products presented. Nothing on this website should be construed as legal, tax, investment, financial, medical, or other professional advice. In addition, no part of this site—including articles or product references—constitutes a solicitation, recommendation, endorsement, advertisement, or offer to buy or sell any securities, franchises, or other financial instruments, particularly in jurisdictions where such activity would be unlawful.
All content is of a general nature and may not address the specific circumstances of any individual or entity. It is not a substitute for professional advice or services. Any actions you take based on the information provided here are strictly at your own risk. You accept full responsibility for any decisions or outcomes arising from your use of this website and agree to release us from any liability in connection with your use of, or reliance upon, the content or products found herein.