
|
Valoración DCF de Synaptics Incorporated (SYNA) |
Completamente Editable: Adáptelo A Sus Necesidades En Excel O Sheets
Diseño Profesional: Plantillas Confiables Y Estándares De La Industria
Predeterminadas Para Un Uso Rápido Y Eficiente
Compatible con MAC / PC, completamente desbloqueado
No Se Necesita Experiencia; Fáciles De Seguir
Synaptics Incorporated (SYNA) Bundle
¡Optimice su tiempo y mejore la precisión con nuestra calculadora DCF de Synaptics Incorporated (SYNA)! Con datos en tiempo real y supuestos personalizables, esta herramienta le permite pronosticar, analizar y valorar Synaptics Incorporated (SYNA) al igual que un inversor profesional.
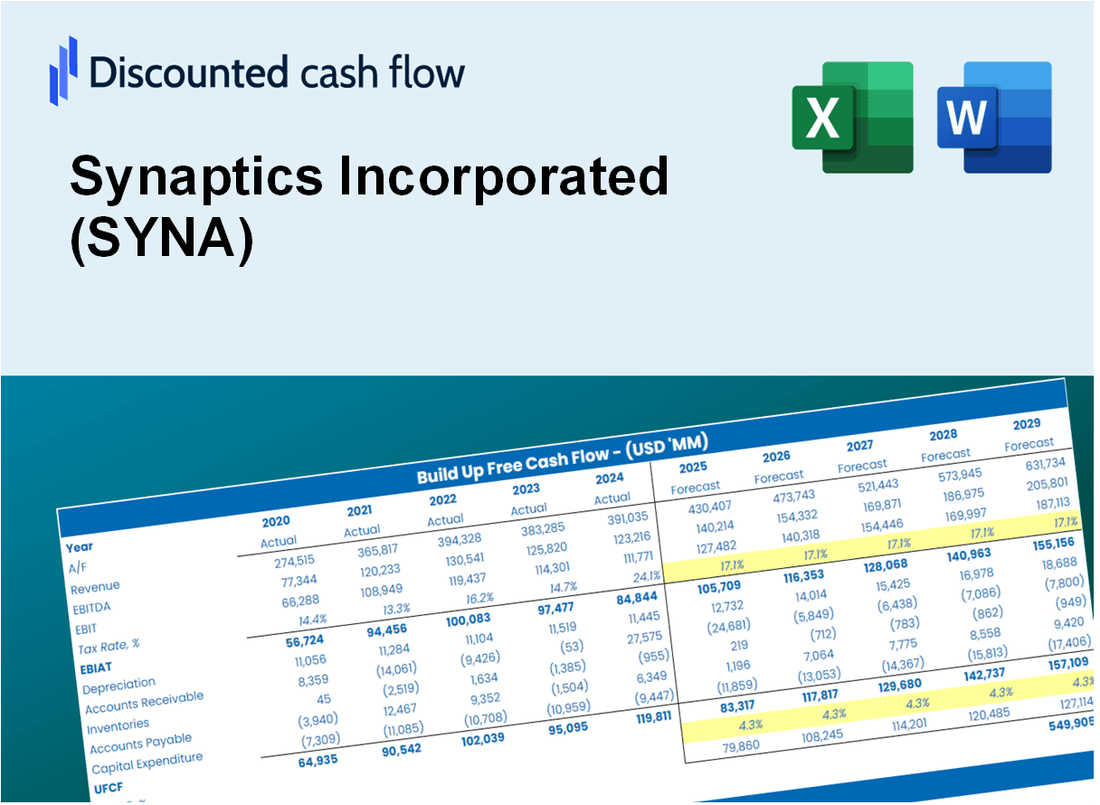
Discounted Cash Flow (DCF) - (USD MM)
| Year | AY1 2021 |
AY2 2022 |
AY3 2023 |
AY4 2024 |
AY5 2025 |
FY1 2026 |
FY2 2027 |
FY3 2028 |
FY4 2029 |
FY5 2030 |
|---|---|---|---|---|---|---|---|---|---|---|
| Revenue | 1,339.6 | 1,739.7 | 1,355.1 | 959.4 | 1,074.3 | 1,048.9 | 1,024.1 | 999.8 | 976.2 | 953.1 |
| Revenue Growth, % | 0 | 29.87 | -22.11 | -29.2 | 11.98 | -2.37 | -2.37 | -2.37 | -2.37 | -2.37 |
| EBITDA | 289.9 | 498.2 | 339.3 | 49.9 | 69.4 | 182.5 | 178.1 | 173.9 | 169.8 | 165.8 |
| EBITDA, % | 21.64 | 28.64 | 25.04 | 5.2 | 6.46 | 17.4 | 17.4 | 17.4 | 17.4 | 17.4 |
| Depreciation | 140.3 | 147.5 | 157.8 | 109.2 | 143.1 | 116.0 | 113.3 | 110.6 | 108.0 | 105.4 |
| Depreciation, % | 10.47 | 8.48 | 11.64 | 11.38 | 13.32 | 11.06 | 11.06 | 11.06 | 11.06 | 11.06 |
| EBIT | 149.6 | 350.7 | 181.5 | -59.3 | -73.7 | 66.5 | 64.9 | 63.3 | 61.8 | 60.4 |
| EBIT, % | 11.17 | 20.16 | 13.39 | -6.18 | -6.86 | 6.34 | 6.34 | 6.34 | 6.34 | 6.34 |
| Total Cash | 836.3 | 876.0 | 934.3 | 876.9 | 452.5 | 661.3 | 645.7 | 630.4 | 615.5 | 600.9 |
| Total Cash, percent | .0 | .0 | .0 | .0 | .0 | .0 | .0 | .0 | .0 | .0 |
| Account Receivables | 228.3 | 323.3 | 165.2 | 143.6 | 130.3 | 157.2 | 153.4 | 149.8 | 146.3 | 142.8 |
| Account Receivables, % | 17.04 | 18.58 | 12.19 | 14.97 | 12.13 | 14.98 | 14.98 | 14.98 | 14.98 | 14.98 |
| Inventories | 82.0 | 169.7 | 137.2 | 114.0 | 139.5 | 106.7 | 104.2 | 101.7 | 99.3 | 97.0 |
| Inventories, % | 6.12 | 9.75 | 10.12 | 11.88 | 12.99 | 10.17 | 10.17 | 10.17 | 10.17 | 10.17 |
| Accounts Payable | 97.6 | 141.8 | 45.8 | 87.5 | 98.5 | 77.8 | 76.0 | 74.2 | 72.4 | 70.7 |
| Accounts Payable, % | 7.29 | 8.15 | 3.38 | 9.12 | 9.17 | 7.42 | 7.42 | 7.42 | 7.42 | 7.42 |
| Capital Expenditure | -21.1 | -61.1 | -34.2 | -167.6 | -35.8 | -59.6 | -58.2 | -56.8 | -55.5 | -54.2 |
| Capital Expenditure, % | -1.58 | -3.51 | -2.52 | -17.47 | -3.33 | -5.68 | -5.68 | -5.68 | -5.68 | -5.68 |
| Tax Rate, % | 57.89 | 57.89 | 57.89 | 57.89 | 57.89 | 57.89 | 57.89 | 57.89 | 57.89 | 57.89 |
| EBITAT | 107.3 | 280.4 | 106.0 | 59.8 | -31.0 | 33.5 | 32.7 | 31.9 | 31.2 | 30.5 |
| Depreciation | ||||||||||
| Changes in Account Receivables | ||||||||||
| Changes in Inventories | ||||||||||
| Changes in Accounts Payable | ||||||||||
| Capital Expenditure | ||||||||||
| UFCF | 13.8 | 228.3 | 324.2 | 87.9 | 75.1 | 75.2 | 92.2 | 90.0 | 87.9 | 85.8 |
| WACC, % | 9.78 | 9.87 | 9.62 | 8.94 | 9.43 | 9.53 | 9.53 | 9.53 | 9.53 | 9.53 |
| PV UFCF | ||||||||||
| SUM PV UFCF | 329.5 | |||||||||
| Long Term Growth Rate, % | 4.00 | |||||||||
| Free cash flow (T + 1) | 89 | |||||||||
| Terminal Value | 1,615 | |||||||||
| Present Terminal Value | 1,024 | |||||||||
| Enterprise Value | 1,354 | |||||||||
| Net Debt | 489 | |||||||||
| Equity Value | 865 | |||||||||
| Diluted Shares Outstanding, MM | 39 | |||||||||
| Equity Value Per Share | 22.02 |
What You Will Get
- Real SYNA Financial Data: Pre-filled with Synaptics Incorporated’s historical and projected data for precise analysis.
- Fully Editable Template: Modify key inputs like revenue growth, WACC, and EBITDA % with ease.
- Automatic Calculations: See Synaptics Incorporated’s intrinsic value update instantly based on your changes.
- Professional Valuation Tool: Designed for investors, analysts, and consultants seeking accurate DCF results.
- User-Friendly Design: Simple structure and clear instructions for all experience levels.
Key Features
- Customizable Financial Inputs: Adjust essential metrics such as revenue growth, EBITDA %, and capital expenditures.
- Instant DCF Valuation: Automatically computes intrinsic value, NPV, and additional metrics in real-time.
- High-Precision Accuracy: Leverages Synaptics' actual financial data for reliable valuation results.
- Simplified Scenario Analysis: Effortlessly evaluate various assumptions and analyze results side by side.
- Efficiency Booster: Streamline the valuation process without the hassle of creating complex models from the ground up.
How It Works
- Step 1: Download the Excel file.
- Step 2: Review Synaptics Incorporated's (SYNA) pre-filled financial data and forecasts.
- Step 3: Modify key inputs such as revenue growth, WACC, and tax rates (highlighted cells).
- Step 4: Observe the DCF model update in real-time as you adjust your assumptions.
- Step 5: Analyze the results and utilize the outputs for your investment strategies.
Why Choose This Calculator for Synaptics Incorporated (SYNA)?
- Designed for Experts: A sophisticated tool tailored for analysts, CFOs, and financial consultants.
- Accurate Financial Data: Synaptics' historical and projected financials are preloaded for precision.
- Versatile Scenario Analysis: Effortlessly simulate various forecasts and assumptions.
- Comprehensive Outputs: Automatically computes intrinsic value, NPV, and essential metrics.
- User-Friendly Interface: Step-by-step guidance ensures a smooth experience.
Who Should Use This Product?
- Finance Students: Master valuation methods and practice with actual data related to Synaptics Incorporated (SYNA).
- Academics: Utilize industry-standard models in your teaching or scholarly research involving Synaptics Incorporated (SYNA).
- Investors: Validate your investment hypotheses and evaluate valuation scenarios for Synaptics Incorporated (SYNA).
- Analysts: Enhance your efficiency with a ready-to-use, adaptable DCF model tailored for Synaptics Incorporated (SYNA).
- Small Business Owners: Understand the analytical approaches used for large public entities like Synaptics Incorporated (SYNA).
What the Template Contains
- Preloaded SYNA Data: Historical and projected financial data, including revenue, EBIT, and capital expenditures.
- DCF and WACC Models: Professional-grade sheets for calculating intrinsic value and Weighted Average Cost of Capital.
- Editable Inputs: Yellow-highlighted cells for adjusting revenue growth, tax rates, and discount rates.
- Financial Statements: Comprehensive annual and quarterly financials for deeper analysis.
- Key Ratios: Profitability, leverage, and efficiency ratios to evaluate performance.
- Dashboard and Charts: Visual summaries of valuation outcomes and assumptions.
Disclaimer
All information, articles, and product details provided on this website are for general informational and educational purposes only. We do not claim any ownership over, nor do we intend to infringe upon, any trademarks, copyrights, logos, brand names, or other intellectual property mentioned or depicted on this site. Such intellectual property remains the property of its respective owners, and any references here are made solely for identification or informational purposes, without implying any affiliation, endorsement, or partnership.
We make no representations or warranties, express or implied, regarding the accuracy, completeness, or suitability of any content or products presented. Nothing on this website should be construed as legal, tax, investment, financial, medical, or other professional advice. In addition, no part of this site—including articles or product references—constitutes a solicitation, recommendation, endorsement, advertisement, or offer to buy or sell any securities, franchises, or other financial instruments, particularly in jurisdictions where such activity would be unlawful.
All content is of a general nature and may not address the specific circumstances of any individual or entity. It is not a substitute for professional advice or services. Any actions you take based on the information provided here are strictly at your own risk. You accept full responsibility for any decisions or outcomes arising from your use of this website and agree to release us from any liability in connection with your use of, or reliance upon, the content or products found herein.