
|
Tata Elxsi Limited (Tataelxsi.ns) DCF Valoración |
Completamente Editable: Adáptelo A Sus Necesidades En Excel O Sheets
Diseño Profesional: Plantillas Confiables Y Estándares De La Industria
Predeterminadas Para Un Uso Rápido Y Eficiente
Compatible con MAC / PC, completamente desbloqueado
No Se Necesita Experiencia; Fáciles De Seguir
Tata Elxsi Limited (TATAELXSI.NS) Bundle
¡Evalúa la perspectiva financiera de Tata Elxsi Limited como un experto! Esta calculadora DCF (tataelxsins) le proporciona datos financieros prefiertos y flexibilidad total para modificar el crecimiento de los ingresos, WACC, los márgenes y otros supuestos esenciales para alinearse con sus proyecciones.
What You Will Receive
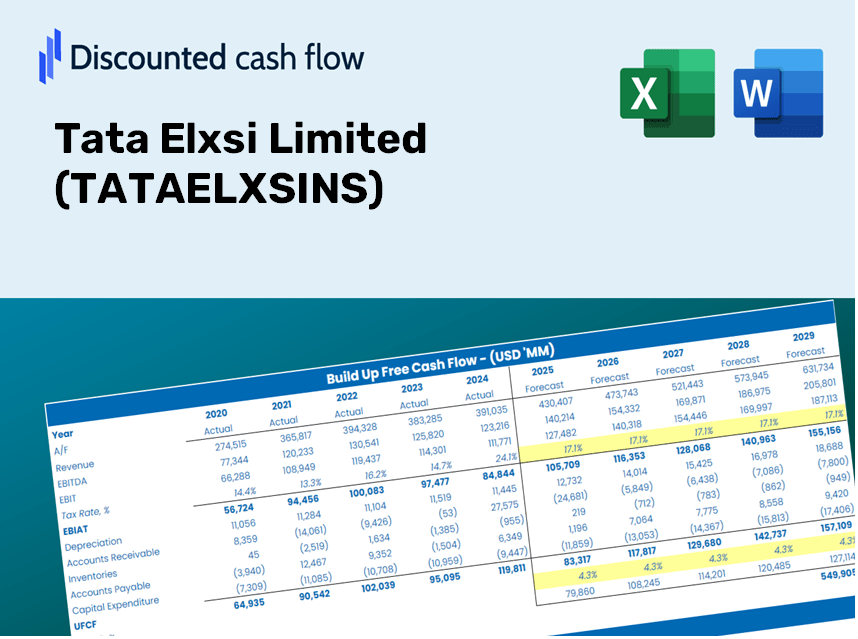
- Genuine Tata Elxsi Data: Preloaded financials – encompassing revenue to EBIT – based on actual and forecasted figures.
- Comprehensive Customization: Modify all essential parameters (yellow cells) such as WACC, growth %, and tax rates.
- Immediate Valuation Updates: Automatic recalculations to evaluate the effects of adjustments on Tata Elxsi’s fair value.
- Flexible Excel Template: Designed for quick modifications, scenario analysis, and in-depth projections.
- Efficient and Accurate: Eliminate the need to construct models from the ground up while ensuring precision and adaptability.
Key Features
- Pre-Loaded Data: Tata Elxsi's historical financial statements and pre-filled forecasts.
- Fully Adjustable Inputs: Modify WACC, tax rates, revenue growth, and EBITDA margins to suit your analysis.
- Instant Results: View the intrinsic value of Tata Elxsi recalculating in real time.
- Clear Visual Outputs: Dashboard charts present valuation results and key performance metrics.
- Built for Accuracy: A professional-grade tool designed for analysts, investors, and finance professionals.
How It Functions
- Step 1: Download the preconfigured Excel template featuring Tata Elxsi Limited’s (TATAELXSINS) data.
- Step 2: Review the pre-filled sheets to gain insights into the essential metrics.
- Step 3: Modify forecasts and assumptions in the editable yellow cells (WACC, growth, margins).
- Step 4: Instantly see updated results, including Tata Elxsi Limited’s (TATAELXSINS) intrinsic value.
- Step 5: Make well-informed investment choices or create reports based on the generated outputs.
Why Opt for This Calculator?
- User-Friendly Interface: Perfectly crafted for both novices and seasoned users.
- Customizable Assumptions: Easily adjust inputs to tailor your analysis.
- Real-Time Updates: Watch Tata Elxsi Limited’s valuation change instantly as you modify the inputs.
- Preconfigured Setup: Comes loaded with Tata Elxsi Limited’s actual financial data for swift evaluations.
- Preferred by Experts: Trusted by investors and analysts for informed decision-making.
Who Can Benefit from This Product?
- Professional Investors: Develop comprehensive valuation models for analyzing TATAELXSINS in their portfolios.
- Corporate Finance Teams: Evaluate valuation scenarios to inform strategic decisions within their organizations.
- Consultants and Advisors: Equip clients with precise valuation insights related to Tata Elxsi Limited (TATAELXSINS) stock.
- Students and Educators: Utilize real-world data to enhance financial modeling skills in academic settings.
- Tech Enthusiasts: Gain insights into the market valuation of tech companies like Tata Elxsi Limited (TATAELXSINS).
Components of the Template
- Preloaded TATAELXSINS Data: Historical and forecasted financial metrics, including revenue, EBIT, and capital expenditures.
- DCF and WACC Models: Expert-level spreadsheets for determining intrinsic value and Weighted Average Cost of Capital.
- Editable Inputs: Yellow-highlighted fields for modifying revenue growth projections, tax rates, and discount rates.
- Financial Statements: Detailed annual and quarterly financial reports for in-depth evaluation.
- Key Ratios: Analysis of profitability, leverage, and efficiency ratios to assess performance.
- Dashboard and Charts: Visual representations of valuation results and underlying assumptions.
Disclaimer
All information, articles, and product details provided on this website are for general informational and educational purposes only. We do not claim any ownership over, nor do we intend to infringe upon, any trademarks, copyrights, logos, brand names, or other intellectual property mentioned or depicted on this site. Such intellectual property remains the property of its respective owners, and any references here are made solely for identification or informational purposes, without implying any affiliation, endorsement, or partnership.
We make no representations or warranties, express or implied, regarding the accuracy, completeness, or suitability of any content or products presented. Nothing on this website should be construed as legal, tax, investment, financial, medical, or other professional advice. In addition, no part of this site—including articles or product references—constitutes a solicitation, recommendation, endorsement, advertisement, or offer to buy or sell any securities, franchises, or other financial instruments, particularly in jurisdictions where such activity would be unlawful.
All content is of a general nature and may not address the specific circumstances of any individual or entity. It is not a substitute for professional advice or services. Any actions you take based on the information provided here are strictly at your own risk. You accept full responsibility for any decisions or outcomes arising from your use of this website and agree to release us from any liability in connection with your use of, or reliance upon, the content or products found herein.