
|
Valoración DCF de Texas Community Bancshares, Inc. (TCBS) |
Completamente Editable: Adáptelo A Sus Necesidades En Excel O Sheets
Diseño Profesional: Plantillas Confiables Y Estándares De La Industria
Predeterminadas Para Un Uso Rápido Y Eficiente
Compatible con MAC / PC, completamente desbloqueado
No Se Necesita Experiencia; Fáciles De Seguir
Texas Community Bancshares, Inc. (TCBS) Bundle
¡Evalúe las perspectivas financieras de Texas Community Bancshares, Inc. (TCBS) como un experto! Esta calculadora DCF (TCBS) le proporciona finanzas precarias y la flexibilidad completa para modificar el crecimiento de los ingresos, WACC, los márgenes y otros supuestos esenciales para alinearse con sus proyecciones.
What You Will Get
- Pre-Filled Financial Model: Texas Community Bancshares, Inc. (TCBS) data allows for accurate DCF valuation.
- Full Forecast Control: Modify revenue growth, profit margins, WACC, and other essential factors.
- Instant Calculations: Real-time updates ensure you see results immediately as adjustments are made.
- Investor-Ready Template: A polished Excel file crafted for high-quality valuation presentations.
- Customizable and Reusable: Designed for adaptability, enabling repeated use for comprehensive forecasts.
Key Features
- Comprehensive Financial Data: Gain access to precise pre-loaded historical financials and future forecasts for Texas Community Bancshares, Inc. (TCBS).
- Tailored Forecast Parameters: Modify highlighted cells for key metrics such as WACC, growth rates, and profit margins.
- Real-Time Calculations: Automatic adjustments to DCF, Net Present Value (NPV), and cash flow evaluations.
- User-Friendly Dashboard: Intuitive charts and summaries to effectively visualize your valuation insights.
- Designed for All Users: A straightforward and accessible layout suitable for investors, CFOs, and consultants alike.
How It Works
- 1. Open the Template: Download and open the Excel file featuring Texas Community Bancshares, Inc. (TCBS) preloaded data.
- 2. Edit Assumptions: Modify essential inputs such as growth rates, WACC, and capital expenditures.
- 3. View Results Instantly: The DCF model automatically calculates intrinsic value and NPV for Texas Community Bancshares, Inc. (TCBS).
- 4. Test Scenarios: Evaluate various forecasts to explore different valuation outcomes.
- 5. Use with Confidence: Share professional valuation insights to inform your strategic decisions.
Why Choose This Calculator for Texas Community Bancshares, Inc. (TCBS)?
- All-in-One Solution: Combines DCF, WACC, and financial ratio analyses tailored for TCBS.
- Flexible Parameters: Modify the yellow-highlighted fields to explore different financial scenarios.
- In-Depth Analysis: Automatically computes TCBS's intrinsic value and Net Present Value.
- Pre-Loaded Information: Access historical and projected data for precise calculations.
- Expert-Level Tool: Perfect for financial analysts, investors, and business advisors focusing on TCBS.
Who Should Use This Product?
- Individual Investors: Gain insights for making informed decisions about investing in Texas Community Bancshares, Inc. (TCBS).
- Financial Analysts: Enhance your valuation processes with comprehensive financial models tailored for Texas Community Bancshares, Inc. (TCBS).
- Consultants: Provide clients with precise and timely valuation insights regarding Texas Community Bancshares, Inc. (TCBS).
- Business Owners: Learn how financial institutions like Texas Community Bancshares, Inc. (TCBS) are valued to inform your own business strategies.
- Finance Students: Explore valuation methodologies using real data and case studies from Texas Community Bancshares, Inc. (TCBS).
What the Template Contains
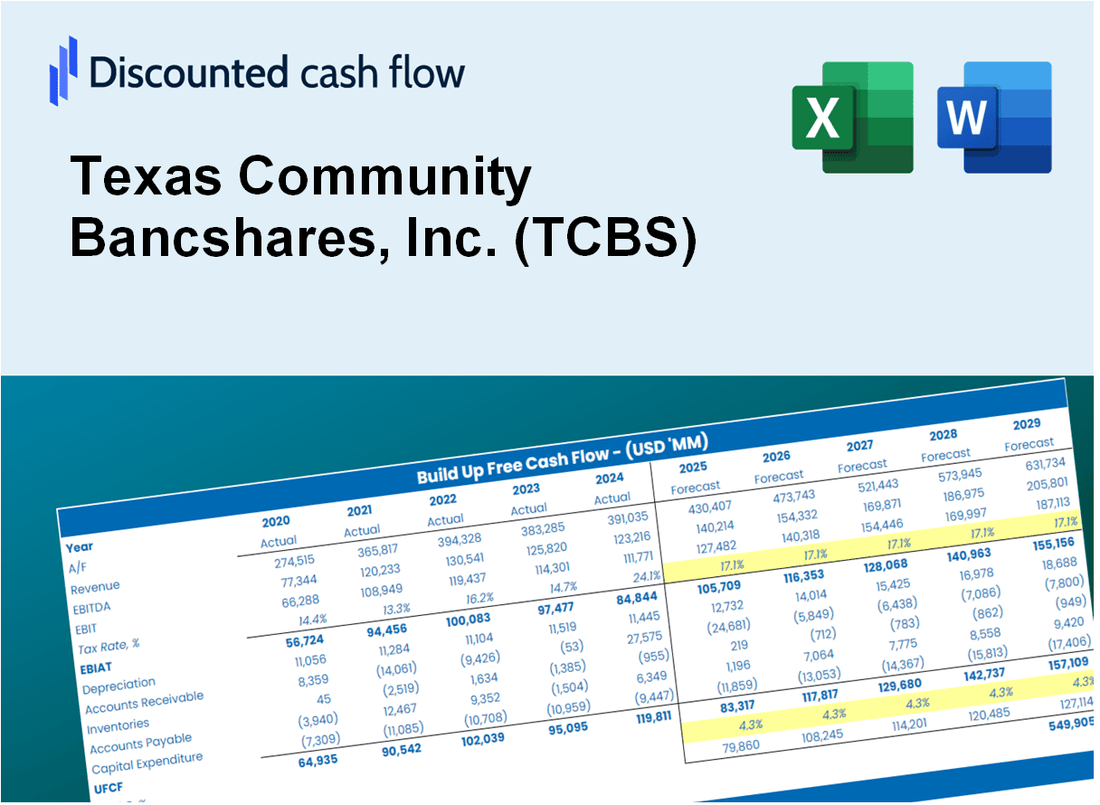
- Preloaded TCBS Data: Historical and projected financial data, including revenue, EBIT, and capital expenditures.
- DCF and WACC Models: Professional-grade sheets for calculating intrinsic value and Weighted Average Cost of Capital.
- Editable Inputs: Yellow-highlighted cells for adjusting revenue growth, tax rates, and discount rates.
- Financial Statements: Comprehensive annual and quarterly financials for deeper analysis.
- Key Ratios: Profitability, leverage, and efficiency ratios to evaluate performance.
- Dashboard and Charts: Visual summaries of valuation outcomes and assumptions.
Disclaimer
All information, articles, and product details provided on this website are for general informational and educational purposes only. We do not claim any ownership over, nor do we intend to infringe upon, any trademarks, copyrights, logos, brand names, or other intellectual property mentioned or depicted on this site. Such intellectual property remains the property of its respective owners, and any references here are made solely for identification or informational purposes, without implying any affiliation, endorsement, or partnership.
We make no representations or warranties, express or implied, regarding the accuracy, completeness, or suitability of any content or products presented. Nothing on this website should be construed as legal, tax, investment, financial, medical, or other professional advice. In addition, no part of this site—including articles or product references—constitutes a solicitation, recommendation, endorsement, advertisement, or offer to buy or sell any securities, franchises, or other financial instruments, particularly in jurisdictions where such activity would be unlawful.
All content is of a general nature and may not address the specific circumstances of any individual or entity. It is not a substitute for professional advice or services. Any actions you take based on the information provided here are strictly at your own risk. You accept full responsibility for any decisions or outcomes arising from your use of this website and agree to release us from any liability in connection with your use of, or reliance upon, the content or products found herein.