
|
Techno eléctrico & Valoración de DCF de la empresa de ingeniería Limited (technoe.ns) |
Completamente Editable: Adáptelo A Sus Necesidades En Excel O Sheets
Diseño Profesional: Plantillas Confiables Y Estándares De La Industria
Predeterminadas Para Un Uso Rápido Y Eficiente
Compatible con MAC / PC, completamente desbloqueado
No Se Necesita Experiencia; Fáciles De Seguir
Techno Electric & Engineering Company Limited (TECHNOE.NS) Bundle
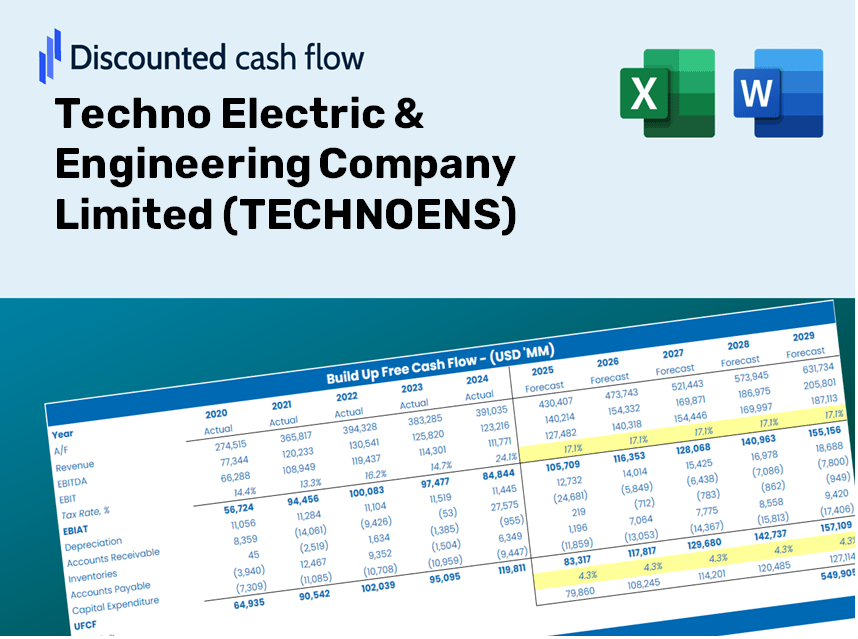
¡Agilice su análisis y mejore la precisión con nuestra calculadora DCF (tecnológica)! Utilización de datos reales de Techno Electric & Engineering Company Limited y personalizable supuestos, esta herramienta le permite pronosticar, analizar y valorar (technoens) al igual que un inversor profesional.
What You Will Receive
- Flexible Input Options: Adjust key assumptions (growth %, profit margins, WACC) to explore various scenarios with ease.
- Industry-Specific Data: TECHONOENS's financial information pre-loaded to facilitate your analysis.
- Automated DCF Calculations: The template computes Net Present Value (NPV) and intrinsic value effortlessly for you.
- Customizable and Sophisticated: A refined Excel model that tailors to your valuation requirements.
- Designed for Analysts and Investors: Perfect for testing forecasts, assessing strategies, and enhancing efficiency.
Key Features
- 🔍 Real-Life TECHNOENS Financials: Pre-filled historical and projected data for Techno Electric & Engineering Company Limited.
- ✏️ Fully Customizable Inputs: Adjust all critical parameters (yellow cells) such as WACC, growth %, and tax rates.
- 📊 Professional DCF Valuation: Built-in formulas calculate the intrinsic value of Techno Electric using the Discounted Cash Flow method.
- ⚡ Instant Results: Visualize Techno Electric’s valuation instantly after making any adjustments.
- Scenario Analysis: Test and compare outcomes for a variety of financial assumptions side-by-side.
How It Works
- Step 1: Download the Excel file for Techno Electric & Engineering Company Limited (TECHNOENS).
- Step 2: Review the pre-filled financial data and projections for TECHN0ENS.
- Step 3: Adjust key inputs such as revenue growth, WACC, and tax rates (highlighted cells).
- Step 4: Observe the DCF model update in real-time as you modify your assumptions.
- Step 5: Examine the results and leverage them for your investment choices.
Why Opt for TECHONOENS's Services?
- Time Efficiency: No need to start from scratch – our solutions are ready for immediate use.
- Enhanced Precision: Trustworthy financial metrics and formulas minimize valuation errors.
- Completely Customizable: Adjust the model to mirror your unique assumptions and forecasts.
- User-Friendly: Intuitive charts and outputs facilitate easy analysis of the results.
- Endorsed by Professionals: Crafted for experts who prioritize accuracy and functionality.
Who Can Benefit from Using Techno Electric & Engineering Company Limited (TECHNOENS)?
- Investors: Make informed investment decisions with our reliable valuation tool.
- Financial Analysts: Streamline your workflow with our ready-to-customize DCF model.
- Consultants: Easily modify the template for effective client presentations and reports.
- Finance Enthusiasts: Enhance your knowledge of valuation methods through practical examples.
- Educators and Students: Utilize our resources as a hands-on learning aid in finance courses.
Contents of the Template
- Comprehensive DCF Model: An editable template featuring detailed valuation calculations.
- Real-World Data: TECHONOENS’s historical and projected financials preloaded for your analysis.
- Customizable Parameters: Modify WACC, growth rates, and tax assumptions to explore different scenarios.
- Financial Statements: Complete annual and quarterly breakdowns for enhanced insights.
- Key Ratios: Integrated analysis for profitability, efficiency, and leverage metrics.
- Dashboard with Visual Outputs: Charts and tables designed for clear, actionable insights.
Disclaimer
All information, articles, and product details provided on this website are for general informational and educational purposes only. We do not claim any ownership over, nor do we intend to infringe upon, any trademarks, copyrights, logos, brand names, or other intellectual property mentioned or depicted on this site. Such intellectual property remains the property of its respective owners, and any references here are made solely for identification or informational purposes, without implying any affiliation, endorsement, or partnership.
We make no representations or warranties, express or implied, regarding the accuracy, completeness, or suitability of any content or products presented. Nothing on this website should be construed as legal, tax, investment, financial, medical, or other professional advice. In addition, no part of this site—including articles or product references—constitutes a solicitation, recommendation, endorsement, advertisement, or offer to buy or sell any securities, franchises, or other financial instruments, particularly in jurisdictions where such activity would be unlawful.
All content is of a general nature and may not address the specific circumstances of any individual or entity. It is not a substitute for professional advice or services. Any actions you take based on the information provided here are strictly at your own risk. You accept full responsibility for any decisions or outcomes arising from your use of this website and agree to release us from any liability in connection with your use of, or reliance upon, the content or products found herein.