
|
Valoración de DCF Tega Industries Limited (TEGA.NS) |
Completamente Editable: Adáptelo A Sus Necesidades En Excel O Sheets
Diseño Profesional: Plantillas Confiables Y Estándares De La Industria
Predeterminadas Para Un Uso Rápido Y Eficiente
Compatible con MAC / PC, completamente desbloqueado
No Se Necesita Experiencia; Fáciles De Seguir
Tega Industries Limited (TEGA.NS) Bundle
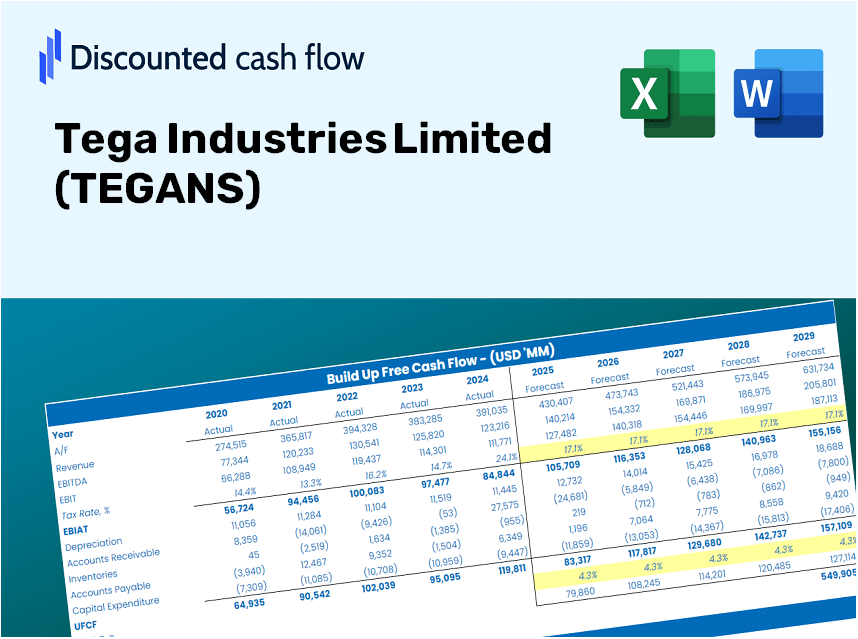
¡Mejore sus estrategias de inversión con la calculadora DCF de TEGA Industries Limited (TEGAN)! Explore datos financieros auténticos, ajuste las proyecciones y gastos de crecimiento, y observe instantáneamente cómo estas modificaciones afectan el valor intrínseco de TEGA Industries Limited (TEGANS).
Benefits You Can Expect
- Comprehensive Financial Model: Leverage Tega Industries Limited’s actual data for accurate DCF valuation.
- Complete Forecast Flexibility: Modify revenue growth, profit margins, WACC, and other critical parameters.
- Real-Time Calculations: Instantaneous updates allow you to view results immediately as adjustments are made.
- Professional-Grade Template: An expertly crafted Excel file suitable for high-quality valuation presentations.
- Adaptable and Multi-Use: Designed for versatility, enabling repeated use for in-depth forecasting.
Key Features
- 🔍 Real-Life TEGANS Financials: Pre-filled historical and projected data for Tega Industries Limited.
- ✏️ Fully Customizable Inputs: Adjust all critical parameters (yellow cells) such as WACC, growth %, and tax rates.
- 📊 Professional DCF Valuation: Built-in formulas to calculate Tega’s intrinsic value using the Discounted Cash Flow method.
- ⚡ Instant Results: Visualize Tega’s valuation immediately after making adjustments.
- Scenario Analysis: Test and compare outcomes for various financial assumptions side-by-side.
How It Works
- Step 1: Download the Excel file.
- Step 2: Examine Tega Industries Limited's (TEGANS) pre-filled financial data and projections.
- Step 3: Adjust key inputs such as revenue growth, WACC, and tax rates (highlighted cells).
- Step 4: Observe the DCF model update in real-time as you modify your assumptions.
- Step 5: Evaluate the outputs and leverage the results for your investment strategies.
Why Opt for This Calculator?
- All-in-One Solution: Features DCF, WACC, and financial ratio analyses conveniently in one platform.
- Flexible Inputs: Modify the yellow-highlighted fields to explore various scenarios.
- In-Depth Analysis: Automatically computes Tega Industries Limited’s intrinsic value and Net Present Value.
- Preloaded Information: Historical and projected data provide accurate baseline metrics.
- High-Quality Standards: Perfect for financial analysts, investors, and business consultants.
Who Should Use This Product?
- Investors: Accurately assess Tega Industries Limited’s (TEGANS) fair value prior to making investment choices.
- CFOs: Utilize a high-quality DCF model for comprehensive financial reporting and analysis related to Tega Industries Limited (TEGANS).
- Consultants: Efficiently customize the template for valuation reports tailored to clients of Tega Industries Limited (TEGANS).
- Entrepreneurs: Acquire insights into the financial modeling practices employed by major corporations like Tega Industries Limited (TEGANS).
- Educators: Employ it as a pedagogical resource to illustrate various valuation methodologies using Tega Industries Limited (TEGANS) as a case study.
Contents of the Template
- Historical Data: Encompasses Tega Industries Limited’s past financial performance and foundational forecasts.
- DCF and Levered DCF Models: Comprehensive templates designed to assess the intrinsic value of Tega Industries Limited (TEGANS).
- WACC Sheet: Ready-to-use calculations for Weighted Average Cost of Capital.
- Editable Inputs: Adjust critical parameters such as growth rates, EBITDA percentages, and CAPEX estimates.
- Quarterly and Annual Statements: A thorough analysis of Tega Industries Limited’s financial statements.
- Interactive Dashboard: Dynamically visualize valuation outcomes and projections.
Disclaimer
All information, articles, and product details provided on this website are for general informational and educational purposes only. We do not claim any ownership over, nor do we intend to infringe upon, any trademarks, copyrights, logos, brand names, or other intellectual property mentioned or depicted on this site. Such intellectual property remains the property of its respective owners, and any references here are made solely for identification or informational purposes, without implying any affiliation, endorsement, or partnership.
We make no representations or warranties, express or implied, regarding the accuracy, completeness, or suitability of any content or products presented. Nothing on this website should be construed as legal, tax, investment, financial, medical, or other professional advice. In addition, no part of this site—including articles or product references—constitutes a solicitation, recommendation, endorsement, advertisement, or offer to buy or sell any securities, franchises, or other financial instruments, particularly in jurisdictions where such activity would be unlawful.
All content is of a general nature and may not address the specific circumstances of any individual or entity. It is not a substitute for professional advice or services. Any actions you take based on the information provided here are strictly at your own risk. You accept full responsibility for any decisions or outcomes arising from your use of this website and agree to release us from any liability in connection with your use of, or reliance upon, the content or products found herein.