
|
Valoración de DCF de Tejas Networks Limited (Tejasnet.NS) |
Completamente Editable: Adáptelo A Sus Necesidades En Excel O Sheets
Diseño Profesional: Plantillas Confiables Y Estándares De La Industria
Predeterminadas Para Un Uso Rápido Y Eficiente
Compatible con MAC / PC, completamente desbloqueado
No Se Necesita Experiencia; Fáciles De Seguir
Tejas Networks Limited (TEJASNET.NS) Bundle
¡Mejore sus opciones de inversión con la calculadora DCF de Tejas Networks Limited (Tejasnetns)! Explore datos financieros auténticos, ajuste las proyecciones y gastos de crecimiento, y observe los efectos inmediatos sobre el valor intrínseco (tejasnetns) con cada cambio.
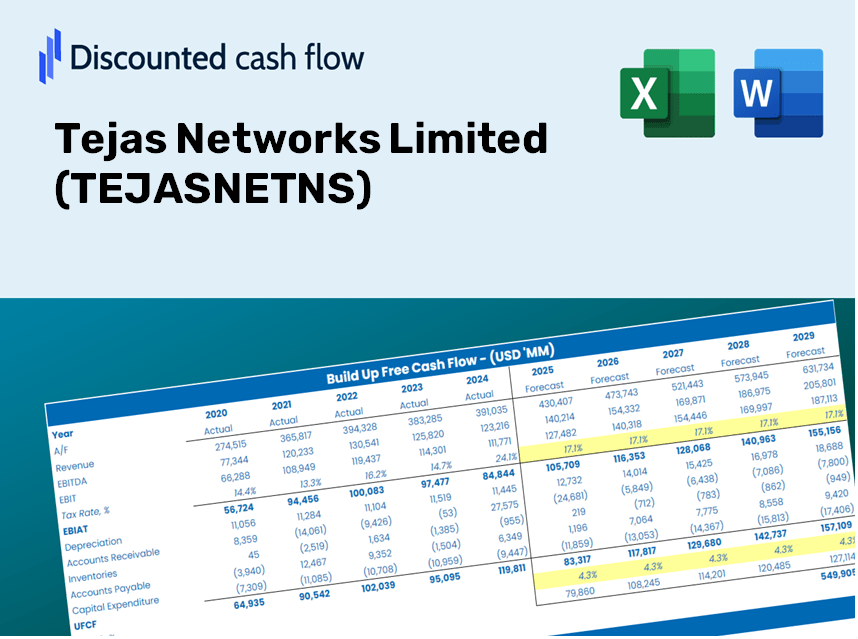
Discounted Cash Flow (DCF) - (USD MM)
| Year | AY1 2021 |
AY2 2022 |
AY3 2023 |
AY4 2024 |
AY5 2025 |
FY1 2026 |
FY2 2027 |
FY3 2028 |
FY4 2029 |
FY5 2030 |
|---|---|---|---|---|---|---|---|---|---|---|
| Revenue | 5,278.7 | 5,531.3 | 9,215.4 | 24,709.2 | 89,232.1 | 149,773.8 | 251,391.6 | 421,954.4 | 708,239.7 | 1,188,762.4 |
| Revenue Growth, % | 0 | 4.79 | 66.6 | 168.13 | 261.13 | 67.85 | 67.85 | 67.85 | 67.85 | 67.85 |
| EBITDA | 187.7 | -1,377.7 | -646.3 | 1,592.7 | 10,495.7 | -3,042.4 | -5,106.7 | -8,571.4 | -14,386.9 | -24,148.0 |
| EBITDA, % | 3.56 | -24.91 | -7.01 | 6.45 | 11.76 | -2.03 | -2.03 | -2.03 | -2.03 | -2.03 |
| Depreciation | 146.9 | 169.3 | 389.7 | 662.9 | 1,445.6 | 4,306.1 | 7,227.7 | 12,131.4 | 20,362.3 | 34,177.6 |
| Depreciation, % | 2.78 | 3.06 | 4.23 | 2.68 | 1.62 | 2.88 | 2.88 | 2.88 | 2.88 | 2.88 |
| EBIT | 40.8 | -1,547.0 | -1,036.0 | 929.8 | 9,050.1 | -7,348.5 | -12,334.3 | -20,702.8 | -34,749.2 | -58,325.6 |
| EBIT, % | 0.77292 | -27.97 | -11.24 | 3.76 | 10.14 | -4.91 | -4.91 | -4.91 | -4.91 | -4.91 |
| Total Cash | 3,470.3 | 10,979.0 | 13,050.4 | 8,460.8 | 8,219.6 | 92,618.5 | 155,457.8 | 260,932.0 | 437,967.7 | 735,117.7 |
| Total Cash, percent | .0 | .0 | .0 | .0 | .0 | .0 | .0 | .0 | .0 | .0 |
| Account Receivables | 3,410.3 | 2,942.2 | 5,344.8 | 14,429.6 | 44,438.5 | 85,069.7 | 142,787.4 | 239,665.0 | 402,271.7 | 675,202.9 |
| Account Receivables, % | 64.6 | 53.19 | 58 | 58.4 | 49.8 | 56.8 | 56.8 | 56.8 | 56.8 | 56.8 |
| Inventories | 2,136.5 | 2,780.2 | 6,468.6 | 37,377.4 | 23,671.9 | 86,107.6 | 144,529.5 | 242,589.0 | 407,179.6 | 683,440.6 |
| Inventories, % | 40.47 | 50.26 | 70.19 | 151.27 | 26.53 | 57.49 | 57.49 | 57.49 | 57.49 | 57.49 |
| Accounts Payable | 922.2 | 1,115.7 | 3,010.2 | 18,393.2 | 11,839.5 | 47,332.3 | 79,446.1 | 133,348.2 | 223,821.7 | 375,679.0 |
| Accounts Payable, % | 17.47 | 20.17 | 32.66 | 74.44 | 13.27 | 31.6 | 31.6 | 31.6 | 31.6 | 31.6 |
| Capital Expenditure | -825.2 | -1,173.5 | -2,490.0 | -4,084.4 | -3,235.1 | -25,169.1 | -42,245.7 | -70,908.3 | -119,017.7 | -199,768.2 |
| Capital Expenditure, % | -15.63 | -21.22 | -27.02 | -16.53 | -3.63 | -16.8 | -16.8 | -16.8 | -16.8 | -16.8 |
| Tax Rate, % | 36.05 | 36.05 | 36.05 | 36.05 | 36.05 | 36.05 | 36.05 | 36.05 | 36.05 | 36.05 |
| EBITAT | 68.0 | -828.2 | -884.4 | 584.3 | 5,787.6 | -5,374.7 | -9,021.3 | -15,142.1 | -25,415.6 | -42,659.4 |
| Depreciation | ||||||||||
| Changes in Account Receivables | ||||||||||
| Changes in Inventories | ||||||||||
| Changes in Accounts Payable | ||||||||||
| Capital Expenditure | ||||||||||
| UFCF | -5,234.9 | -1,814.5 | -7,181.2 | -27,447.8 | -18,859.0 | -93,811.9 | -128,065.1 | -214,954.0 | -360,794.8 | -605,584.9 |
| WACC, % | 5.07 | 4.3 | 4.83 | 4.46 | 4.47 | 4.63 | 4.63 | 4.63 | 4.63 | 4.63 |
| PV UFCF | ||||||||||
| SUM PV UFCF | -1,178,420.6 | |||||||||
| Long Term Growth Rate, % | 2.00 | |||||||||
| Free cash flow (T + 1) | -617,697 | |||||||||
| Terminal Value | -23,513,038 | |||||||||
| Present Terminal Value | -18,753,791 | |||||||||
| Enterprise Value | -19,932,212 | |||||||||
| Net Debt | 30,672 | |||||||||
| Equity Value | -19,962,884 | |||||||||
| Diluted Shares Outstanding, MM | 176 | |||||||||
| Equity Value Per Share | -113,482.86 |
What You Will Receive
- Comprehensive Financial Model: Utilize Tejas Networks Limited's (TEJASNETNS) actual data for accurate DCF valuation.
- Complete Forecast Control: Modify revenue growth, profit margins, WACC, and other essential drivers as needed.
- Real-Time Calculations: Automatic updates display results instantly as you make adjustments.
- Professional-Grade Template: A polished Excel file crafted for high-quality valuation presentations.
- Fully Customizable and Reusable: Designed for adaptability, enabling repeated application for in-depth forecasts.
Key Features
- Comprehensive TEJASNETNS Data: Pre-loaded with Tejas Networks Limited's historical financials and future growth estimates.
- Customizable Input Options: Tailor revenue growth rates, profit margins, discount rates, tax percentages, and capital expenditure plans.
- Interactive Valuation Model: Automatically recalculates Net Present Value (NPV) and intrinsic value according to your specified inputs.
- Scenario Analysis: Develop various forecasting scenarios to evaluate diverse valuation results.
- Intuitive User Interface: Designed with simplicity and organization in mind, catering to both experts and newcomers.
How It Functions
- Step 1: Download the Excel file.
- Step 2: Examine Tejas Networks Limited's (TEJASNETNS) pre-populated financial data and projections.
- Step 3: Adjust essential inputs such as revenue growth, WACC, and tax rates (highlighted cells).
- Step 4: Observe the DCF model update in real-time as you modify your assumptions.
- Step 5: Evaluate the results and leverage the findings for investment decisions.
Why Choose Tejas Networks Limited (TEJASNETNS) Calculator?
- Time-Efficient: Skip the hassle of building a DCF model from the ground up – it's readily available.
- Enhanced Precision: Dependable financial data and formulas minimize valuation errors.
- Completely Customizable: Adjust the model to match your specific assumptions and forecasts.
- User-Friendly: Intuitive charts and outputs simplify result analysis.
- Endorsed by Professionals: Crafted for industry experts who prioritize accuracy and ease of use.
Who Can Benefit from This Product?
- Investors: Precisely determine the fair value of Tejas Networks Limited (TEJASNETNS) before making investment choices.
- CFOs: Utilize a professional-grade DCF model for accurate financial reporting and analysis.
- Consultants: Easily customize the template for valuation reports tailored to client needs.
- Entrepreneurs: Discover financial modeling techniques employed by leading corporations.
- Educators: Implement it as a teaching resource to illustrate various valuation methods.
Contents of the Template
- Detailed DCF Model: An editable template featuring extensive valuation calculations.
- Market Data: Tejas Networks Limited’s historical and projected financials are preloaded for in-depth analysis.
- Adjustable Parameters: Modify WACC, growth rates, and tax assumptions to explore various scenarios.
- Comprehensive Financial Statements: Complete annual and quarterly breakdowns for enhanced insights.
- Essential Ratios: Integrated analysis of profitability, efficiency, and leverage metrics.
- Interactive Dashboard: Visual outputs including charts and tables for clear, actionable insights.
Disclaimer
All information, articles, and product details provided on this website are for general informational and educational purposes only. We do not claim any ownership over, nor do we intend to infringe upon, any trademarks, copyrights, logos, brand names, or other intellectual property mentioned or depicted on this site. Such intellectual property remains the property of its respective owners, and any references here are made solely for identification or informational purposes, without implying any affiliation, endorsement, or partnership.
We make no representations or warranties, express or implied, regarding the accuracy, completeness, or suitability of any content or products presented. Nothing on this website should be construed as legal, tax, investment, financial, medical, or other professional advice. In addition, no part of this site—including articles or product references—constitutes a solicitation, recommendation, endorsement, advertisement, or offer to buy or sell any securities, franchises, or other financial instruments, particularly in jurisdictions where such activity would be unlawful.
All content is of a general nature and may not address the specific circumstances of any individual or entity. It is not a substitute for professional advice or services. Any actions you take based on the information provided here are strictly at your own risk. You accept full responsibility for any decisions or outcomes arising from your use of this website and agree to release us from any liability in connection with your use of, or reliance upon, the content or products found herein.