
|
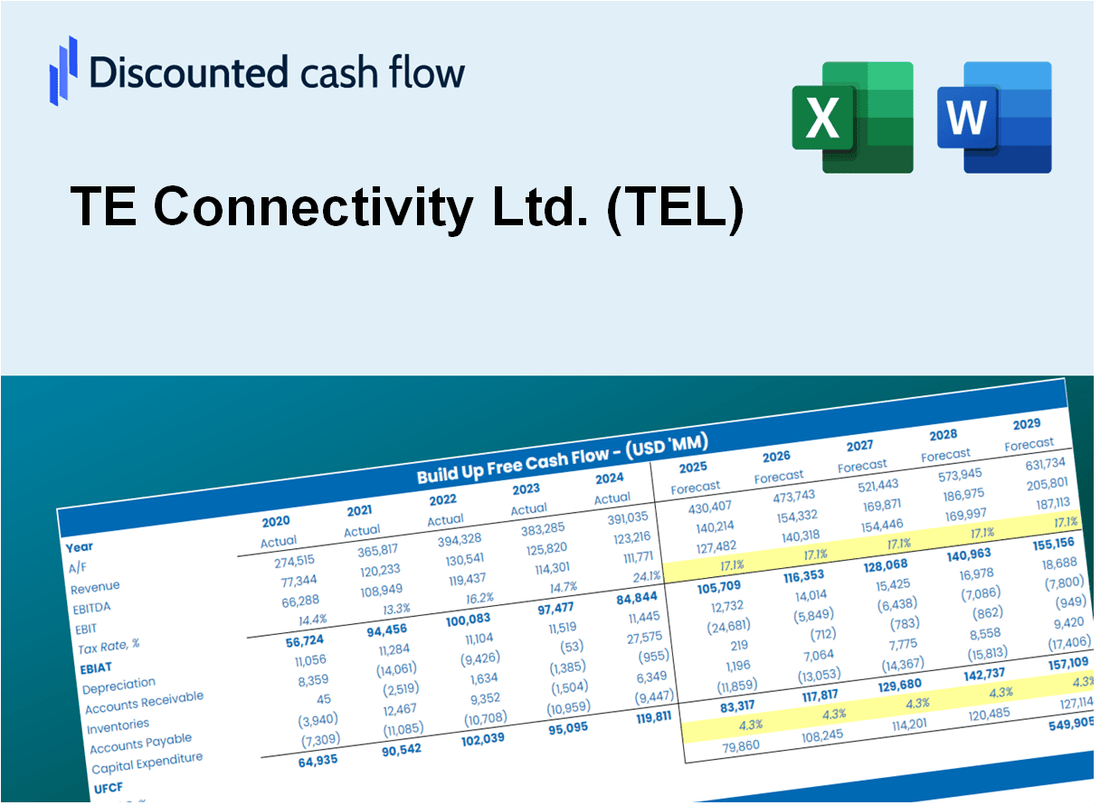
Valoración DCF de TE Connectivity Ltd. (TEL) |
Completamente Editable: Adáptelo A Sus Necesidades En Excel O Sheets
Diseño Profesional: Plantillas Confiables Y Estándares De La Industria
Predeterminadas Para Un Uso Rápido Y Eficiente
Compatible con MAC / PC, completamente desbloqueado
No Se Necesita Experiencia; Fáciles De Seguir
TE Connectivity Ltd. (TEL) Bundle
¡Mejore su estrategia de inversión con la calculadora DCF de TE Connectivity Ltd. (Tel)! Explore datos financieros auténticos, ajuste las proyecciones y gastos de crecimiento, y observe instantáneamente cómo estos cambios afectan el valor intrínseco de TE Connectivity Ltd. (Tel).
Discounted Cash Flow (DCF) - (USD MM)
| Year | AY1 2021 |
AY2 2022 |
AY3 2023 |
AY4 2024 |
AY5 2025 |
FY1 2026 |
FY2 2027 |
FY3 2028 |
FY4 2029 |
FY5 2030 |
|---|---|---|---|---|---|---|---|---|---|---|
| Revenue | 14,923.0 | 16,281.0 | 16,034.0 | 15,845.0 | 17,089.0 | 17,698.0 | 18,328.7 | 18,981.9 | 19,658.4 | 20,359.0 |
| Revenue Growth, % | 0 | 9.1 | -1.52 | -1.18 | 7.85 | 3.56 | 3.56 | 3.56 | 3.56 | 3.56 |
| EBITDA | 3,203.0 | 3,584.0 | 3,142.0 | 3,693.0 | 4,119.0 | 3,910.7 | 4,050.0 | 4,194.4 | 4,343.8 | 4,498.7 |
| EBITDA, % | 21.46 | 22.01 | 19.6 | 23.31 | 24.1 | 22.1 | 22.1 | 22.1 | 22.1 | 22.1 |
| Depreciation | 769.0 | 785.0 | 794.0 | 826.0 | 838.0 | 886.4 | 918.0 | 950.7 | 984.6 | 1,019.7 |
| Depreciation, % | 5.15 | 4.82 | 4.95 | 5.21 | 4.9 | 5.01 | 5.01 | 5.01 | 5.01 | 5.01 |
| EBIT | 2,434.0 | 2,799.0 | 2,348.0 | 2,867.0 | 3,281.0 | 3,024.2 | 3,132.0 | 3,243.6 | 3,359.2 | 3,478.9 |
| EBIT, % | 16.31 | 17.19 | 14.64 | 18.09 | 19.2 | 17.09 | 17.09 | 17.09 | 17.09 | 17.09 |
| Total Cash | 1,203.0 | 1,088.0 | 1,661.0 | 1,319.0 | 1,255.0 | 1,443.2 | 1,494.6 | 1,547.8 | 1,603.0 | 1,660.1 |
| Total Cash, percent | .0 | .0 | .0 | .0 | .0 | .0 | .0 | .0 | .0 | .0 |
| Account Receivables | 2,928.0 | 2,865.0 | 2,967.0 | 3,055.0 | 3,403.0 | 3,359.7 | 3,479.4 | 3,603.4 | 3,731.8 | 3,864.8 |
| Account Receivables, % | 19.62 | 17.6 | 18.5 | 19.28 | 19.91 | 18.98 | 18.98 | 18.98 | 18.98 | 18.98 |
| Inventories | 2,511.0 | 2,676.0 | 2,552.0 | 2,517.0 | 2,699.0 | 2,862.0 | 2,964.0 | 3,069.7 | 3,179.1 | 3,292.4 |
| Inventories, % | 16.83 | 16.44 | 15.92 | 15.89 | 15.79 | 16.17 | 16.17 | 16.17 | 16.17 | 16.17 |
| Accounts Payable | 1,911.0 | 1,593.0 | 1,563.0 | 1,728.0 | 2,021.0 | 1,949.3 | 2,018.7 | 2,090.7 | 2,165.2 | 2,242.3 |
| Accounts Payable, % | 12.81 | 9.78 | 9.75 | 10.91 | 11.83 | 11.01 | 11.01 | 11.01 | 11.01 | 11.01 |
| Capital Expenditure | -690.0 | -768.0 | -732.0 | -680.0 | -936.0 | -838.0 | -867.9 | -898.8 | -930.8 | -964.0 |
| Capital Expenditure, % | -4.62 | -4.72 | -4.57 | -4.29 | -5.48 | -4.73 | -4.73 | -4.73 | -4.73 | -4.73 |
| Tax Rate, % | 42.51 | 42.51 | 42.51 | 42.51 | 42.51 | 42.51 | 42.51 | 42.51 | 42.51 | 42.51 |
| EBITAT | 2,314.2 | 2,486.6 | 1,977.4 | 3,272.9 | 1,886.3 | 2,574.4 | 2,666.1 | 2,761.1 | 2,859.5 | 2,961.4 |
| Depreciation | ||||||||||
| Changes in Account Receivables | ||||||||||
| Changes in Inventories | ||||||||||
| Changes in Accounts Payable | ||||||||||
| Capital Expenditure | ||||||||||
| UFCF | -1,134.8 | 2,083.6 | 2,031.4 | 3,530.9 | 1,551.3 | 2,431.4 | 2,564.0 | 2,655.4 | 2,750.0 | 2,848.0 |
| WACC, % | 9.14 | 9.12 | 9.11 | 9.15 | 9.04 | 9.11 | 9.11 | 9.11 | 9.11 | 9.11 |
| PV UFCF | ||||||||||
| SUM PV UFCF | 10,207.8 | |||||||||
| Long Term Growth Rate, % | 3.00 | |||||||||
| Free cash flow (T + 1) | 2,933 | |||||||||
| Terminal Value | 47,993 | |||||||||
| Present Terminal Value | 31,032 | |||||||||
| Enterprise Value | 41,239 | |||||||||
| Net Debt | 4,439 | |||||||||
| Equity Value | 36,800 | |||||||||
| Diluted Shares Outstanding, MM | 299 | |||||||||
| Equity Value Per Share | 123.08 |
What You Will Receive
- Customizable Excel Template: A fully adjustable Excel-based DCF Calculator featuring pre-populated financial data for TE Connectivity Ltd. (TEL).
- Comprehensive Data: Access to historical figures and forward-looking projections (highlighted in the yellow cells).
- Assumption Flexibility: Modify forecast parameters such as revenue growth, EBITDA %, and WACC.
- Real-Time Calculations: Instantly observe how your inputs affect TE Connectivity’s valuation.
- Professional Resource: Designed for investors, CFOs, consultants, and financial analysts.
- Intuitive Interface: Organized for clarity and ease of navigation, complete with step-by-step guidance.
Key Features
- Comprehensive TE Connectivity Financials: Gain access to precise pre-loaded historical data and future forecasts.
- Adjustable Forecast Parameters: Modify highlighted cells for WACC, growth rates, and profit margins.
- Real-Time Calculations: Automatic updates for DCF, Net Present Value (NPV), and cash flow assessments.
- Interactive Dashboard: User-friendly charts and summaries to visualize your valuation outcomes.
- Designed for All Users: An intuitive layout tailored for investors, CFOs, and consultants alike.
How It Works
- Download: Obtain the pre-built Excel file containing TE Connectivity Ltd.'s (TEL) financial data.
- Customize: Modify projections, such as revenue growth, EBITDA %, and WACC.
- Update Automatically: The intrinsic value and NPV calculations refresh in real-time.
- Test Scenarios: Generate various forecasts and instantly compare results.
- Make Decisions: Utilize the valuation findings to inform your investment approach.
Why Choose TE Connectivity Ltd. (TEL)?
- Save Time: Instantly access comprehensive connectivity solutions without the hassle of extensive research.
- Enhance Reliability: High-quality products ensure dependable performance across various applications.
- Fully Customizable: Solutions can be tailored to meet specific industry requirements and challenges.
- User-Friendly: Intuitive designs and documentation simplify the integration process.
- Backed by Expertise: Trusted by industry leaders for innovative technologies and exceptional support.
Who Should Use This Product?
- Professional Investors: Construct in-depth and accurate valuation models for analyzing TE Connectivity Ltd. (TEL) within their portfolios.
- Corporate Finance Teams: Evaluate valuation scenarios to inform strategic decisions at their organizations.
- Consultants and Advisors: Deliver precise valuation insights for clients interested in TE Connectivity Ltd. (TEL) stock.
- Students and Educators: Utilize real-time data to enhance learning and practice in financial modeling.
- Tech Enthusiasts: Gain insights into how companies like TE Connectivity Ltd. (TEL) are valued in the technology sector.
What the Template Contains
- Pre-Filled DCF Model: TE Connectivity Ltd.’s (TEL) financial data preloaded for immediate use.
- WACC Calculator: Detailed calculations for Weighted Average Cost of Capital.
- Financial Ratios: Evaluate TE Connectivity Ltd.’s (TEL) profitability, leverage, and efficiency.
- Editable Inputs: Change assumptions such as growth, margins, and CAPEX to fit your scenarios.
- Financial Statements: Annual and quarterly reports to support detailed analysis.
- Interactive Dashboard: Easily visualize key valuation metrics and results.
Disclaimer
All information, articles, and product details provided on this website are for general informational and educational purposes only. We do not claim any ownership over, nor do we intend to infringe upon, any trademarks, copyrights, logos, brand names, or other intellectual property mentioned or depicted on this site. Such intellectual property remains the property of its respective owners, and any references here are made solely for identification or informational purposes, without implying any affiliation, endorsement, or partnership.
We make no representations or warranties, express or implied, regarding the accuracy, completeness, or suitability of any content or products presented. Nothing on this website should be construed as legal, tax, investment, financial, medical, or other professional advice. In addition, no part of this site—including articles or product references—constitutes a solicitation, recommendation, endorsement, advertisement, or offer to buy or sell any securities, franchises, or other financial instruments, particularly in jurisdictions where such activity would be unlawful.
All content is of a general nature and may not address the specific circumstances of any individual or entity. It is not a substitute for professional advice or services. Any actions you take based on the information provided here are strictly at your own risk. You accept full responsibility for any decisions or outcomes arising from your use of this website and agree to release us from any liability in connection with your use of, or reliance upon, the content or products found herein.