
|
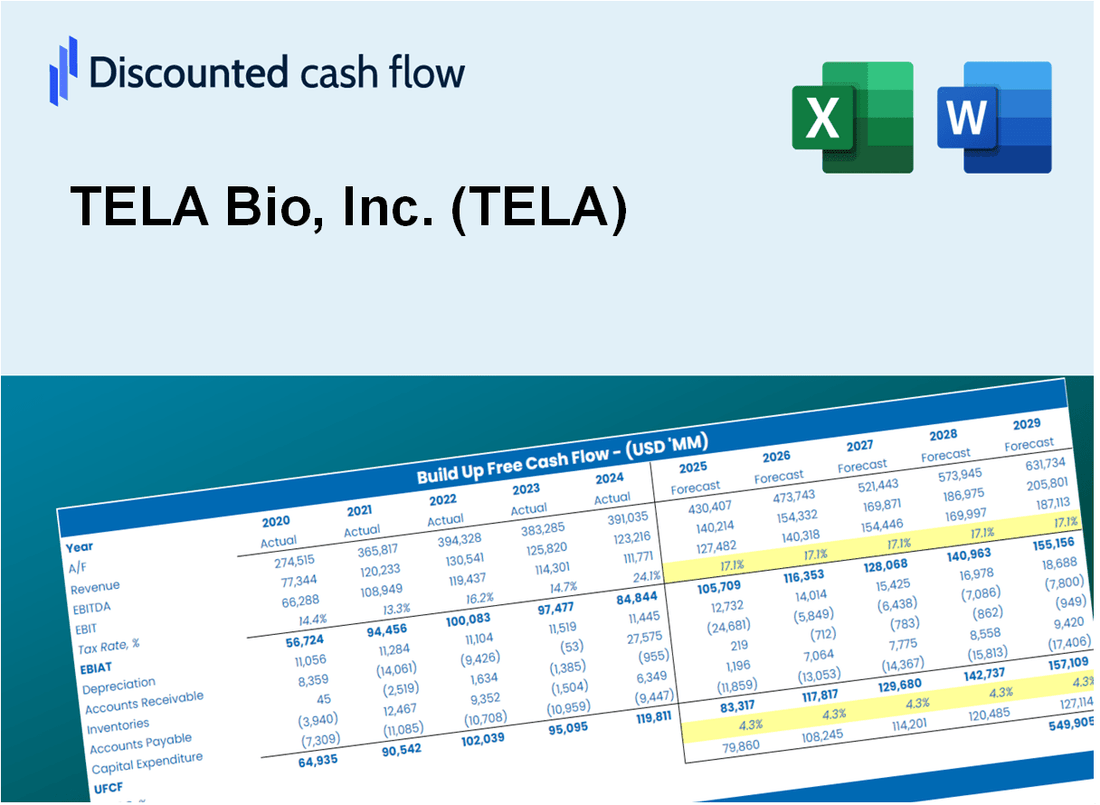
Valoración DCF de TELA Bio, Inc. (TELA) |
Completamente Editable: Adáptelo A Sus Necesidades En Excel O Sheets
Diseño Profesional: Plantillas Confiables Y Estándares De La Industria
Predeterminadas Para Un Uso Rápido Y Eficiente
Compatible con MAC / PC, completamente desbloqueado
No Se Necesita Experiencia; Fáciles De Seguir
TELA Bio, Inc. (TELA) Bundle
¡Mejore sus estrategias de inversión con la calculadora DCF de Tela Bio, Inc. (Tela)! Utilice datos financieros de Tela precisos, ajuste las proyecciones y gastos de crecimiento, y observe instantáneamente cómo estas modificaciones influyen en el valor intrínseco de Tela.
What You Will Get
- Editable Forecast Inputs: Easily modify assumptions (growth %, margins, WACC) to develop various scenarios.
- Real-World Data: TELA Bio, Inc.'s (TELA) financial data pre-loaded to facilitate your analysis.
- Automatic DCF Outputs: The template computes Net Present Value (NPV) and intrinsic value automatically.
- Customizable and Professional: A refined Excel model that adjusts to your valuation requirements.
- Built for Analysts and Investors: Perfect for evaluating projections, confirming strategies, and enhancing efficiency.
Key Features
- Accurate TELA Bio Financials: Gain access to reliable pre-loaded historical data and future forecasts.
- Tailorable Forecast Inputs: Modify highlighted cells for parameters like WACC, growth rates, and profit margins.
- Real-Time Calculations: Automatic updates for DCF, Net Present Value (NPV), and cash flow assessments.
- Interactive Dashboard: User-friendly charts and summaries to help visualize your valuation outcomes.
- Designed for All Users: An easy-to-navigate format suitable for investors, CFOs, and consultants alike.
How It Works
- Download: Obtain the comprehensive Excel file featuring TELA Bio, Inc.'s (TELA) financial data.
- Customize: Tailor your forecasts, including revenue growth, EBITDA %, and WACC to your preferences.
- Update Automatically: Watch as the intrinsic value and NPV calculations refresh in real-time.
- Test Scenarios: Develop various projections and instantly compare the results.
- Make Decisions: Leverage the valuation outcomes to inform your investment choices.
Why Choose This Calculator for TELA Bio, Inc. (TELA)?
- Designed for Experts: A sophisticated tool utilized by industry analysts, CFOs, and healthcare consultants.
- Accurate Data: TELA Bio’s historical and projected financials are preloaded for precision.
- Flexible Scenario Analysis: Effortlessly simulate various forecasts and assumptions.
- Comprehensive Outputs: Automatically computes intrinsic value, NPV, and essential metrics.
- User-Friendly: Step-by-step guidance ensures a smooth experience throughout the process.
Who Should Use TELA Bio, Inc. (TELA)?
- Investors: Assess TELA's fair value to inform your investment strategies.
- CFOs: Utilize a comprehensive DCF model for accurate financial reporting and analysis.
- Consultants: Easily modify the template for client valuation reports related to TELA.
- Entrepreneurs: Discover financial modeling techniques employed by leading biotech firms.
- Educators: Implement this resource as a teaching aid for valuation practices in the biotech sector.
What the Template Contains
- Comprehensive DCF Model: Editable template with detailed valuation calculations for TELA Bio, Inc. (TELA).
- Real-World Data: TELA Bio's historical and projected financials preloaded for analysis.
- Customizable Parameters: Adjust WACC, growth rates, and tax assumptions to test various scenarios.
- Financial Statements: Full annual and quarterly breakdowns for deeper insights into TELA's performance.
- Key Ratios: Built-in analysis for profitability, efficiency, and leverage specific to TELA Bio, Inc. (TELA).
- Dashboard with Visual Outputs: Charts and tables providing clear, actionable results for stakeholders.
Disclaimer
All information, articles, and product details provided on this website are for general informational and educational purposes only. We do not claim any ownership over, nor do we intend to infringe upon, any trademarks, copyrights, logos, brand names, or other intellectual property mentioned or depicted on this site. Such intellectual property remains the property of its respective owners, and any references here are made solely for identification or informational purposes, without implying any affiliation, endorsement, or partnership.
We make no representations or warranties, express or implied, regarding the accuracy, completeness, or suitability of any content or products presented. Nothing on this website should be construed as legal, tax, investment, financial, medical, or other professional advice. In addition, no part of this site—including articles or product references—constitutes a solicitation, recommendation, endorsement, advertisement, or offer to buy or sell any securities, franchises, or other financial instruments, particularly in jurisdictions where such activity would be unlawful.
All content is of a general nature and may not address the specific circumstances of any individual or entity. It is not a substitute for professional advice or services. Any actions you take based on the information provided here are strictly at your own risk. You accept full responsibility for any decisions or outcomes arising from your use of this website and agree to release us from any liability in connection with your use of, or reliance upon, the content or products found herein.