
|
Valoración DCF de TFS Financial Corporation (TFSL) |
Completamente Editable: Adáptelo A Sus Necesidades En Excel O Sheets
Diseño Profesional: Plantillas Confiables Y Estándares De La Industria
Predeterminadas Para Un Uso Rápido Y Eficiente
Compatible con MAC / PC, completamente desbloqueado
No Se Necesita Experiencia; Fáciles De Seguir
TFS Financial Corporation (TFSL) Bundle
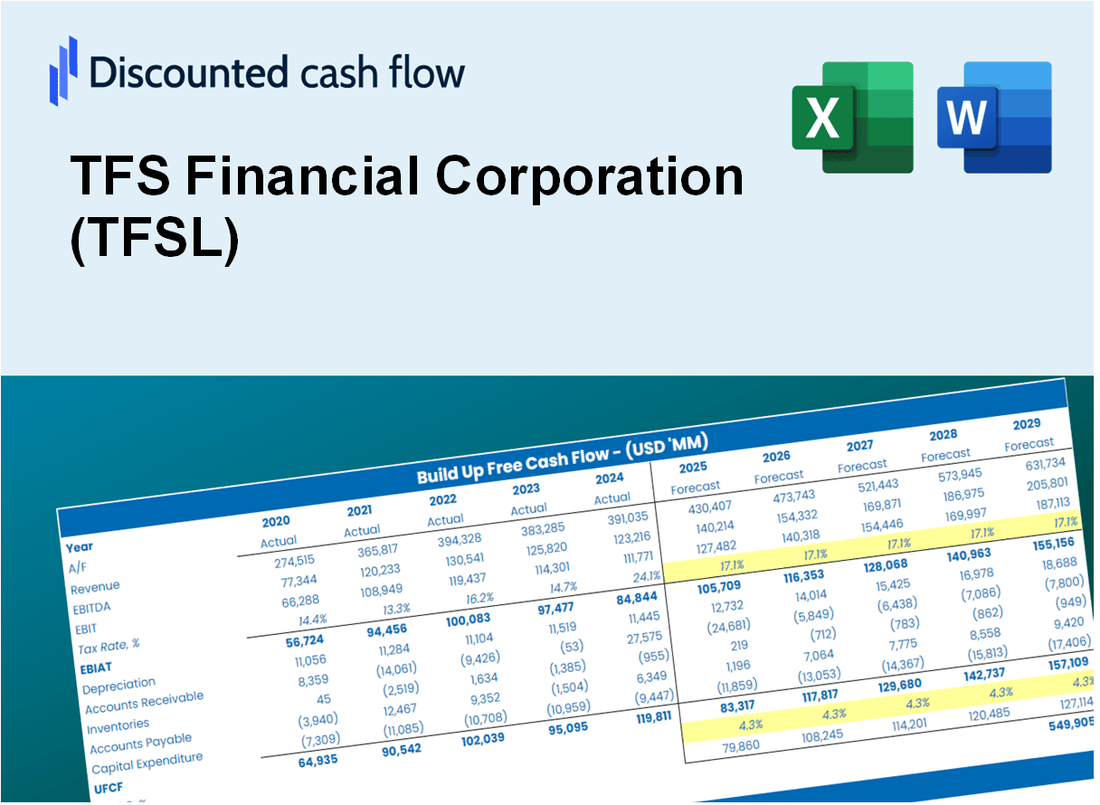
¡Mejore sus estrategias de inversión con la calculadora DCF de TFS Financial Corporation (TFSL)! Explore las finanzas de TFS auténticas, ajuste las proyecciones y gastos de crecimiento, y observe cómo estas modificaciones afectan el valor intrínseco de TFS Financial Corporation (TFSL) en tiempo real.
What You Will Receive
- Authentic TFSL Financial Data: Pre-loaded with TFS Financial Corporation’s historical and forecasted data for accurate analysis.
- Completely Customizable Template: Easily adjust key metrics such as revenue growth, WACC, and EBITDA %.
- Instant Calculations: Watch TFS Financial Corporation’s intrinsic value update in real-time as you make adjustments.
- Expert Valuation Tool: Tailored for investors, analysts, and consultants aiming for precise DCF outcomes.
- Intuitive Design: Clear layout and straightforward instructions suitable for all skill levels.
Key Features
- Comprehensive Financial Data: Gain access to precise pre-loaded historical figures and future forecasts for TFS Financial Corporation (TFSL).
- Adjustable Forecast Parameters: Modify highlighted cells for critical metrics such as WACC, growth rates, and profit margins.
- Real-Time Calculations: Enjoy automatic updates for DCF, Net Present Value (NPV), and cash flow assessments.
- User-Friendly Dashboard: Intuitive charts and summaries to help you visualize your valuation outcomes.
- Designed for All Skill Levels: A straightforward, accessible format tailored for investors, CFOs, and consultants alike.
How It Works
- Step 1: Download the Excel file.
- Step 2: Review pre-entered TFS Financial Corporation (TFSL) data (historical and projected).
- Step 3: Adjust key assumptions (yellow cells) based on your analysis.
- Step 4: View automatic recalculations for TFS Financial Corporation’s intrinsic value.
- Step 5: Use the outputs for investment decisions or reporting.
Why Choose TFS Financial Corporation (TFSL)?
- Streamlined Processes: Eliminate the hassle of complex financial modeling – our solutions are user-friendly and ready to go.
- Enhanced Precision: Access to accurate financial metrics and methodologies minimizes valuation discrepancies.
- Fully Adaptable: Customize our tools to align with your financial forecasts and strategic goals.
- Clear Insights: Intuitive visualizations and reports facilitate straightforward analysis of your data.
- Endorsed by Industry Leaders: Crafted for professionals who prioritize accuracy and efficiency in their financial endeavors.
Who Should Use This Product?
- Finance Students: Explore financial modeling techniques and apply them to real-world data for TFS Financial Corporation (TFSL).
- Academics: Integrate industry-standard valuation models into your research or teaching focused on TFS Financial Corporation (TFSL).
- Investors: Evaluate your investment strategies and analyze the financial performance of TFS Financial Corporation (TFSL).
- Analysts: Enhance your analysis process with a customizable DCF model tailored for TFS Financial Corporation (TFSL).
- Small Business Owners: Understand the valuation methods used for larger financial institutions like TFS Financial Corporation (TFSL).
What the Template Contains
- Pre-Filled DCF Model: TFS Financial Corporation’s (TFSL) financial data preloaded for immediate use.
- WACC Calculator: Detailed calculations for Weighted Average Cost of Capital.
- Financial Ratios: Evaluate TFS Financial Corporation’s (TFSL) profitability, leverage, and efficiency.
- Editable Inputs: Change assumptions such as growth, margins, and CAPEX to fit your scenarios.
- Financial Statements: Annual and quarterly reports to support detailed analysis.
- Interactive Dashboard: Easily visualize key valuation metrics and results.
Disclaimer
All information, articles, and product details provided on this website are for general informational and educational purposes only. We do not claim any ownership over, nor do we intend to infringe upon, any trademarks, copyrights, logos, brand names, or other intellectual property mentioned or depicted on this site. Such intellectual property remains the property of its respective owners, and any references here are made solely for identification or informational purposes, without implying any affiliation, endorsement, or partnership.
We make no representations or warranties, express or implied, regarding the accuracy, completeness, or suitability of any content or products presented. Nothing on this website should be construed as legal, tax, investment, financial, medical, or other professional advice. In addition, no part of this site—including articles or product references—constitutes a solicitation, recommendation, endorsement, advertisement, or offer to buy or sell any securities, franchises, or other financial instruments, particularly in jurisdictions where such activity would be unlawful.
All content is of a general nature and may not address the specific circumstances of any individual or entity. It is not a substitute for professional advice or services. Any actions you take based on the information provided here are strictly at your own risk. You accept full responsibility for any decisions or outcomes arising from your use of this website and agree to release us from any liability in connection with your use of, or reliance upon, the content or products found herein.