|
Valoración DCF de Tredegar Corporation (TG) |
Completamente Editable: Adáptelo A Sus Necesidades En Excel O Sheets
Diseño Profesional: Plantillas Confiables Y Estándares De La Industria
Predeterminadas Para Un Uso Rápido Y Eficiente
Compatible con MAC / PC, completamente desbloqueado
No Se Necesita Experiencia; Fáciles De Seguir
Tredegar Corporation (TG) Bundle
¡Evalúe las perspectivas financieras de Tredegar Corporation como un experto! Esta calculadora DCF (TG) le proporciona datos financieros precipidos y la libertad de modificar el crecimiento de los ingresos, WACC, los márgenes y otros supuestos esenciales para alinearse con sus predicciones.
What You Will Get
- Real TG Financials: Access to historical and projected data for precise valuation.
- Customizable Inputs: Adjust WACC, tax rates, revenue growth, and capital expenditures as needed.
- Dynamic Calculations: Intrinsic value and NPV are computed automatically.
- Scenario Analysis: Evaluate various scenarios to assess Tredegar Corporation's future performance.
- User-Friendly Design: Designed for professionals while remaining approachable for newcomers.
Key Features
- Customizable Financial Inputs: Adjust essential factors such as revenue projections, operating margin %, and capital investments.
- Instant DCF Valuation: Automatically computes intrinsic value, net present value (NPV), and additional metrics in real-time.
- High-Precision Accuracy: Leverages Tredegar Corporation’s (TG) actual financial data for credible valuation results.
- Effortless Scenario Testing: Easily explore various assumptions and analyze their impacts on outcomes.
- Efficiency Booster: Streamlines the valuation process, removing the necessity for intricate model construction from the ground up.
How It Works
- Download the Template: Gain immediate access to the Excel-based TG DCF Calculator.
- Input Your Assumptions: Modify the yellow-highlighted cells for growth rates, WACC, margins, and other variables.
- Instant Calculations: The model automatically recalculates Tredegar Corporation’s intrinsic value.
- Test Scenarios: Experiment with various assumptions to assess potential changes in valuation.
- Analyze and Decide: Utilize the outcomes to inform your investment or financial analysis.
Why Choose This Calculator for Tredegar Corporation (TG)?
- Accurate Data: Up-to-date Tredegar financials provide dependable valuation outcomes.
- Customizable: Modify essential parameters such as growth rates, WACC, and tax rates to fit your forecasts.
- Time-Saving: Pre-configured calculations save you from starting from the ground up.
- Professional-Grade Tool: Tailored for investors, analysts, and financial consultants.
- User-Friendly: Easy-to-navigate design and clear instructions facilitate use for everyone.
Who Should Use Tredegar Corporation (TG)?
- Investors: Gain insights into investment opportunities with our comprehensive analysis tools.
- Financial Analysts: Streamline your workflow with our customizable financial models tailored for Tredegar Corporation (TG).
- Consultants: Effortlessly modify reports and presentations to meet client needs using our resources.
- Finance Enthusiasts: Enhance your knowledge of the industry through detailed case studies and data from Tredegar Corporation (TG).
- Educators and Students: Utilize our materials as a hands-on resource for finance education and research projects.
What the Template Contains
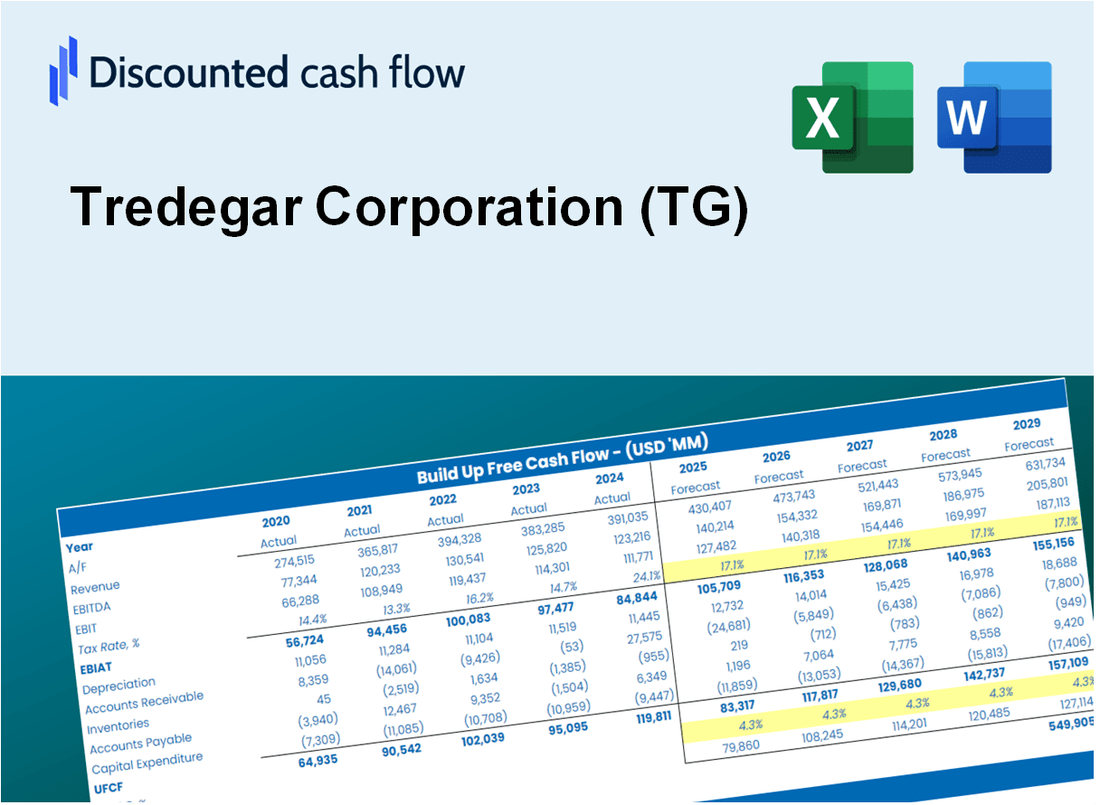
- Operating and Balance Sheet Data: Pre-filled Tredegar Corporation (TG) historical data and forecasts, including revenue, EBITDA, EBIT, and capital expenditures.
- WACC Calculation: A dedicated sheet for Weighted Average Cost of Capital (WACC), encompassing parameters such as Beta, risk-free rate, and share price.
- DCF Valuation (Unlevered and Levered): Editable Discounted Cash Flow models illustrating intrinsic value with comprehensive calculations.
- Financial Statements: Pre-loaded financial statements (annual and quarterly) to facilitate analysis.
- Key Ratios: Incorporates profitability, leverage, and efficiency ratios for Tredegar Corporation (TG).
- Dashboard and Charts: Visual summary of valuation outputs and assumptions for straightforward result analysis.
Disclaimer
All information, articles, and product details provided on this website are for general informational and educational purposes only. We do not claim any ownership over, nor do we intend to infringe upon, any trademarks, copyrights, logos, brand names, or other intellectual property mentioned or depicted on this site. Such intellectual property remains the property of its respective owners, and any references here are made solely for identification or informational purposes, without implying any affiliation, endorsement, or partnership.
We make no representations or warranties, express or implied, regarding the accuracy, completeness, or suitability of any content or products presented. Nothing on this website should be construed as legal, tax, investment, financial, medical, or other professional advice. In addition, no part of this site—including articles or product references—constitutes a solicitation, recommendation, endorsement, advertisement, or offer to buy or sell any securities, franchises, or other financial instruments, particularly in jurisdictions where such activity would be unlawful.
All content is of a general nature and may not address the specific circumstances of any individual or entity. It is not a substitute for professional advice or services. Any actions you take based on the information provided here are strictly at your own risk. You accept full responsibility for any decisions or outcomes arising from your use of this website and agree to release us from any liability in connection with your use of, or reliance upon, the content or products found herein.