
|
Valoración de DCF de Theon International Plc (theon.as) |
Completamente Editable: Adáptelo A Sus Necesidades En Excel O Sheets
Diseño Profesional: Plantillas Confiables Y Estándares De La Industria
Predeterminadas Para Un Uso Rápido Y Eficiente
Compatible con MAC / PC, completamente desbloqueado
No Se Necesita Experiencia; Fáciles De Seguir
Theon International PLC (THEON.AS) Bundle
Ingementada para su precisión, nuestra calculadora DCF (theonas) le permite evaluar la valoración de Theon International PLC utilizando datos financieros del mundo real, ofreciendo una flexibilidad completa para modificar todos los parámetros clave para las proyecciones mejoradas.
What You Will Receive
- Authentic THEONAS Financial Data: Pre-populated with Theon International PLC’s historical and forecasted data for detailed analysis.
- Fully Customizable Template: Easily adjust key parameters such as revenue growth, WACC, and EBITDA percentage.
- Instant Calculations: Watch as Theon’s intrinsic value recalibrates in real-time based on your modifications.
- Professional Valuation Tool: Tailored for investors, analysts, and consultants aiming for accurate DCF evaluations.
- User-Friendly Interface: Intuitive layout and straightforward instructions suitable for all skill levels.
Key Features
- 🔍 Real-Life THEONAS Financials: Pre-filled historical and projected data for Theon International PLC.
- ✏️ Fully Customizable Inputs: Modify all essential parameters (yellow cells) such as WACC, growth %, and tax rates.
- 📊 Professional DCF Valuation: Integrated formulas to determine Theon’s intrinsic value using the Discounted Cash Flow method.
- ⚡ Instant Results: Quickly visualize Theon’s valuation as soon as you make adjustments.
- Scenario Analysis: Evaluate and compare results for different financial assumptions side-by-side.
How It Functions
- 1. Access the Template: Download and open the Excel file containing THEON INTERNATIONAL PLC’s preloaded data.
- 2. Adjust Assumptions: Modify essential inputs such as growth rates, WACC, and capital expenditures.
- 3. See Results Instantly: The DCF model automatically computes intrinsic value and NPV in real-time.
- 4. Experiment with Scenarios: Evaluate various forecasts to explore different valuation results.
- 5. Utilize with Assurance: Present expert valuation analyses to guide your strategic decisions.
Why Opt for THEON INTERNATIONAL PLC Calculator?
- Precision: Utilizing authentic THEON financial data guarantees accuracy.
- Versatility: Crafted to allow users to experiment and adjust inputs effortlessly.
- Efficiency: Avoid the complexities of creating a DCF model from the ground up.
- Expert-Level: Engineered with the care and usability expected by CFOs.
- Accessible: Intuitive design makes it simple for users without deep financial modeling skills.
Who Can Benefit from This Product?
- Finance Students: Discover valuation methodologies and practice with actual data.
- Academics: Integrate advanced models into your research or teaching materials.
- Investors: Validate your hypotheses and evaluate valuation results for THEON INTERNATIONAL PLC (THEONAS) stock.
- Analysts: Enhance your efficiency with a customizable DCF model that’s ready to use.
- Small Business Owners: Understand the analytical approaches used for large publicly traded companies like THEON INTERNATIONAL PLC (THEONAS).
Overview of Template Components
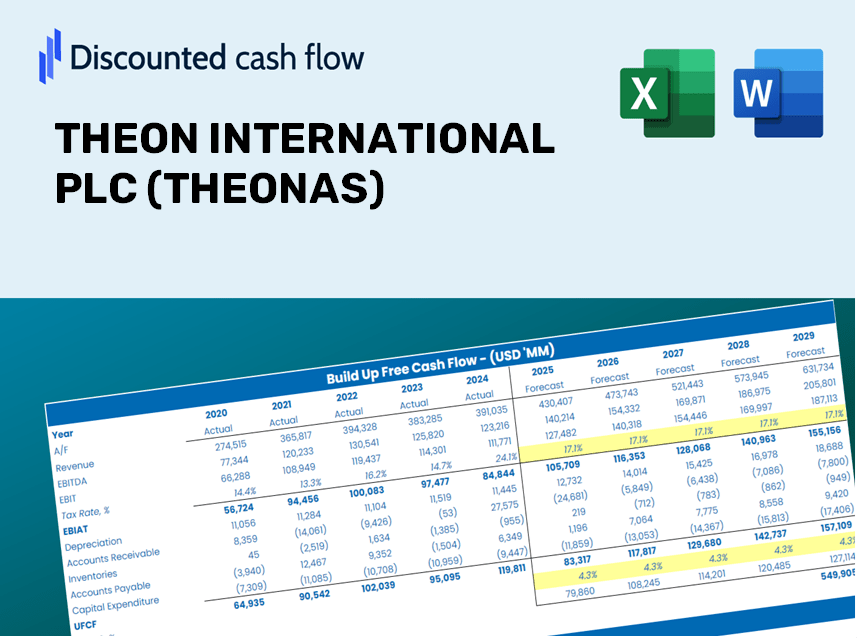
- Preloaded THEON Data: Historical and forecasted financial metrics, including revenue, EBIT, and capital expenses.
- DCF and WACC Models: Advanced spreadsheets for determining intrinsic value and Weighted Average Cost of Capital.
- Customizable Inputs: Cells highlighted in yellow for modifying revenue growth, tax rates, and discount rates.
- Financial Statements: Detailed annual and quarterly financial reports for in-depth analysis.
- Key Ratios: Metrics for profitability, leverage, and efficiency to assess performance.
- Dashboard and Charts: Visual representations of valuation results and underlying assumptions.
Disclaimer
All information, articles, and product details provided on this website are for general informational and educational purposes only. We do not claim any ownership over, nor do we intend to infringe upon, any trademarks, copyrights, logos, brand names, or other intellectual property mentioned or depicted on this site. Such intellectual property remains the property of its respective owners, and any references here are made solely for identification or informational purposes, without implying any affiliation, endorsement, or partnership.
We make no representations or warranties, express or implied, regarding the accuracy, completeness, or suitability of any content or products presented. Nothing on this website should be construed as legal, tax, investment, financial, medical, or other professional advice. In addition, no part of this site—including articles or product references—constitutes a solicitation, recommendation, endorsement, advertisement, or offer to buy or sell any securities, franchises, or other financial instruments, particularly in jurisdictions where such activity would be unlawful.
All content is of a general nature and may not address the specific circumstances of any individual or entity. It is not a substitute for professional advice or services. Any actions you take based on the information provided here are strictly at your own risk. You accept full responsibility for any decisions or outcomes arising from your use of this website and agree to release us from any liability in connection with your use of, or reliance upon, the content or products found herein.