
|
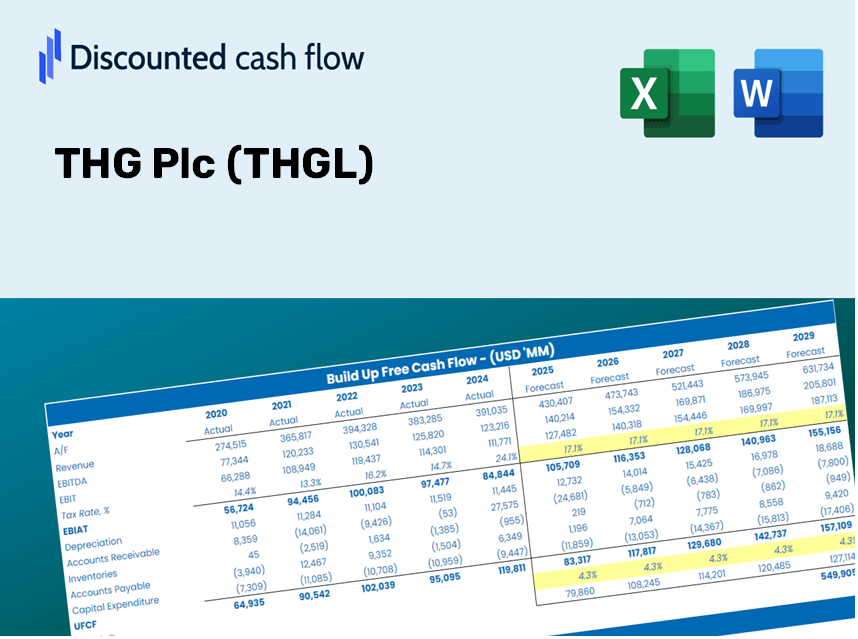
THG PLC (THG.L) DCF Valoración |
Completamente Editable: Adáptelo A Sus Necesidades En Excel O Sheets
Diseño Profesional: Plantillas Confiables Y Estándares De La Industria
Predeterminadas Para Un Uso Rápido Y Eficiente
Compatible con MAC / PC, completamente desbloqueado
No Se Necesita Experiencia; Fáciles De Seguir
THG Plc (THG.L) Bundle
¡Explore el potencial financiero de THG PLC (THGL) con nuestra calculadora DCF fácil de usar! Ingrese sus proyecciones para el crecimiento, los márgenes de beneficio y los gastos para calcular el valor intrínseco de THG PLC (THGL) y refinar su enfoque de inversión.
Discounted Cash Flow (DCF) - (USD MM)
| Year | AY1 2020 |
AY2 2021 |
AY3 2022 |
AY4 2023 |
AY5 2024 |
FY1 2025 |
FY2 2026 |
FY3 2027 |
FY4 2028 |
FY5 2029 |
|---|---|---|---|---|---|---|---|---|---|---|
| Revenue | 1,613.6 | 2,179.9 | 2,239.2 | 2,045.4 | 1,751.4 | 1,816.1 | 1,883.3 | 1,952.9 | 2,025.1 | 2,099.9 |
| Revenue Growth, % | 0 | 35.09 | 2.72 | -8.66 | -14.37 | 3.7 | 3.7 | 3.7 | 3.7 | 3.7 |
| EBITDA | -376.3 | 32.1 | -289.4 | 42.4 | -48.6 | -128.9 | -133.6 | -138.6 | -143.7 | -149.0 |
| EBITDA, % | -23.32 | 1.47 | -12.93 | 2.07 | -2.78 | -7.1 | -7.1 | -7.1 | -7.1 | -7.1 |
| Depreciation | 105.3 | 169.5 | 203.2 | 214.5 | 90.2 | 141.7 | 146.9 | 152.4 | 158.0 | 163.8 |
| Depreciation, % | 6.53 | 7.78 | 9.07 | 10.49 | 5.15 | 7.8 | 7.8 | 7.8 | 7.8 | 7.8 |
| EBIT | -481.6 | -137.4 | -492.6 | -172.1 | -138.8 | -270.6 | -280.6 | -290.9 | -301.7 | -312.9 |
| EBIT, % | -29.85 | -6.3 | -22 | -8.41 | -7.93 | -14.9 | -14.9 | -14.9 | -14.9 | -14.9 |
| Total Cash | 773.6 | 536.8 | 473.8 | 416.2 | 309.3 | 478.5 | 496.2 | 514.5 | 533.5 | 553.3 |
| Total Cash, percent | .0 | .0 | .0 | .0 | .0 | .0 | .0 | .0 | .0 | .0 |
| Account Receivables | 233.6 | 242.6 | 239.0 | 184.1 | 134.0 | 192.2 | 199.4 | 206.7 | 214.4 | 222.3 |
| Account Receivables, % | 14.48 | 11.13 | 10.67 | 9 | 7.65 | 10.59 | 10.59 | 10.59 | 10.59 | 10.59 |
| Inventories | 302.7 | 466.8 | 373.3 | 297.1 | 265.4 | 314.3 | 325.9 | 337.9 | 350.4 | 363.4 |
| Inventories, % | 18.76 | 21.41 | 16.67 | 14.53 | 15.15 | 17.3 | 17.3 | 17.3 | 17.3 | 17.3 |
| Accounts Payable | 254.6 | 297.5 | 321.7 | 368.9 | 246.0 | 275.6 | 285.8 | 296.4 | 307.3 | 318.7 |
| Accounts Payable, % | 15.78 | 13.65 | 14.37 | 18.03 | 14.05 | 15.18 | 15.18 | 15.18 | 15.18 | 15.18 |
| Capital Expenditure | -239.4 | -189.2 | -176.4 | -125.7 | -31.7 | -142.9 | -148.2 | -153.7 | -159.4 | -165.2 |
| Capital Expenditure, % | -14.83 | -8.68 | -7.88 | -6.14 | -1.81 | -7.87 | -7.87 | -7.87 | -7.87 | -7.87 |
| Tax Rate, % | -61.14 | -61.14 | -61.14 | -61.14 | -61.14 | -61.14 | -61.14 | -61.14 | -61.14 | -61.14 |
| EBITAT | -479.8 | -101.9 | -483.8 | -169.6 | -223.7 | -254.6 | -264.0 | -273.8 | -283.9 | -294.4 |
| Depreciation | ||||||||||
| Changes in Account Receivables | ||||||||||
| Changes in Inventories | ||||||||||
| Changes in Accounts Payable | ||||||||||
| Capital Expenditure | ||||||||||
| UFCF | -895.5 | -251.7 | -335.8 | 97.3 | -206.2 | -333.4 | -273.8 | -284.0 | -294.5 | -305.3 |
| WACC, % | 11.95 | 10.69 | 11.88 | 11.9 | 11.97 | 11.68 | 11.68 | 11.68 | 11.68 | 11.68 |
| PV UFCF | ||||||||||
| SUM PV UFCF | -1,087.0 | |||||||||
| Long Term Growth Rate, % | 2.00 | |||||||||
| Free cash flow (T + 1) | -311 | |||||||||
| Terminal Value | -3,218 | |||||||||
| Present Terminal Value | -1,852 | |||||||||
| Enterprise Value | -2,939 | |||||||||
| Net Debt | 337 | |||||||||
| Equity Value | -3,276 | |||||||||
| Diluted Shares Outstanding, MM | 1,369 | |||||||||
| Equity Value Per Share | -239.40 |
What You Will Receive
- Customizable Excel Template: A fully adjustable Excel-based DCF Calculator featuring pre-filled THG Plc (THGL) financial data.
- Authentic Data: Access to historical data and forward-looking projections (highlighted in the yellow cells).
- Flexible Forecasting: Adjust key assumptions such as revenue growth, EBITDA percentage, and WACC.
- Instant Calculations: Quickly assess how your inputs affect the valuation of THG Plc (THGL).
- Professional Resource: Designed for investors, CFOs, consultants, and financial analysts.
- User-Friendly Layout: Organized for clarity and simplicity, with comprehensive step-by-step guidance.
Highlighted Features
- Authentic THG Financials: Gain access to precise historical data and future forecasts pre-loaded for your convenience.
- Adjustable Forecast Variables: Modify the yellow-highlighted fields such as WACC, growth rates, and profit margins.
- Real-Time Calculations: Automatic updates for DCF, Net Present Value (NPV), and cash flow assessments.
- User-Friendly Dashboard: Clear, accessible charts and summaries to help you interpret your valuation outcomes.
- Suitable for All Skill Levels: Designed with simplicity in mind for investors, CFOs, and consultants alike.
How It Works
- Step 1: Download the Excel file.
- Step 2: Examine THG Plc’s pre-filled financial data and projections.
- Step 3: Adjust key inputs such as revenue growth, WACC, and tax rates (highlighted cells).
- Step 4: Observe the DCF model update in real-time as you modify your assumptions.
- Step 5: Review the outputs and leverage the results for informed investment decisions.
Why Select This Calculator for THG Plc (THGL)?
- Precision: Utilizes accurate financial data from THG Plc for reliable calculations.
- Versatility: Crafted to allow users to easily test and adjust inputs as needed.
- Efficiency: Eliminate the tedious process of creating a DCF model from the ground up.
- Expert-Level: Built with the sophistication and usability expected by CFOs.
- Intuitive: Designed for ease of use, even for individuals without extensive financial modeling knowledge.
Who Can Benefit from This Product?
- Investors: Evaluate the valuation of THG Plc (THGL) before making stock transactions.
- CFOs and Financial Analysts: Optimize valuation workflows and assess financial forecasts.
- Startup Founders: Discover how leading companies like THG Plc (THGL) are valued in the market.
- Consultants: Create detailed valuation reports for your clients using THG Plc (THGL) as a case study.
- Students and Educators: Apply real market data to practice and instruct valuation methodologies.
Contents of the Template
- Comprehensive DCF Model: Editable template featuring in-depth valuation calculations.
- Real-World Data: THG Plc’s (THGL) historical and projected financials preloaded for your analysis.
- Customizable Parameters: Modify WACC, growth rates, and tax assumptions to explore various scenarios.
- Financial Statements: Complete annual and quarterly breakdowns for enhanced insights.
- Key Ratios: Integrated analysis for assessing profitability, efficiency, and leverage.
- Dashboard with Visual Outputs: Visualizations and tables for straightforward, actionable results.
Disclaimer
All information, articles, and product details provided on this website are for general informational and educational purposes only. We do not claim any ownership over, nor do we intend to infringe upon, any trademarks, copyrights, logos, brand names, or other intellectual property mentioned or depicted on this site. Such intellectual property remains the property of its respective owners, and any references here are made solely for identification or informational purposes, without implying any affiliation, endorsement, or partnership.
We make no representations or warranties, express or implied, regarding the accuracy, completeness, or suitability of any content or products presented. Nothing on this website should be construed as legal, tax, investment, financial, medical, or other professional advice. In addition, no part of this site—including articles or product references—constitutes a solicitation, recommendation, endorsement, advertisement, or offer to buy or sell any securities, franchises, or other financial instruments, particularly in jurisdictions where such activity would be unlawful.
All content is of a general nature and may not address the specific circumstances of any individual or entity. It is not a substitute for professional advice or services. Any actions you take based on the information provided here are strictly at your own risk. You accept full responsibility for any decisions or outcomes arising from your use of this website and agree to release us from any liability in connection with your use of, or reliance upon, the content or products found herein.