
|
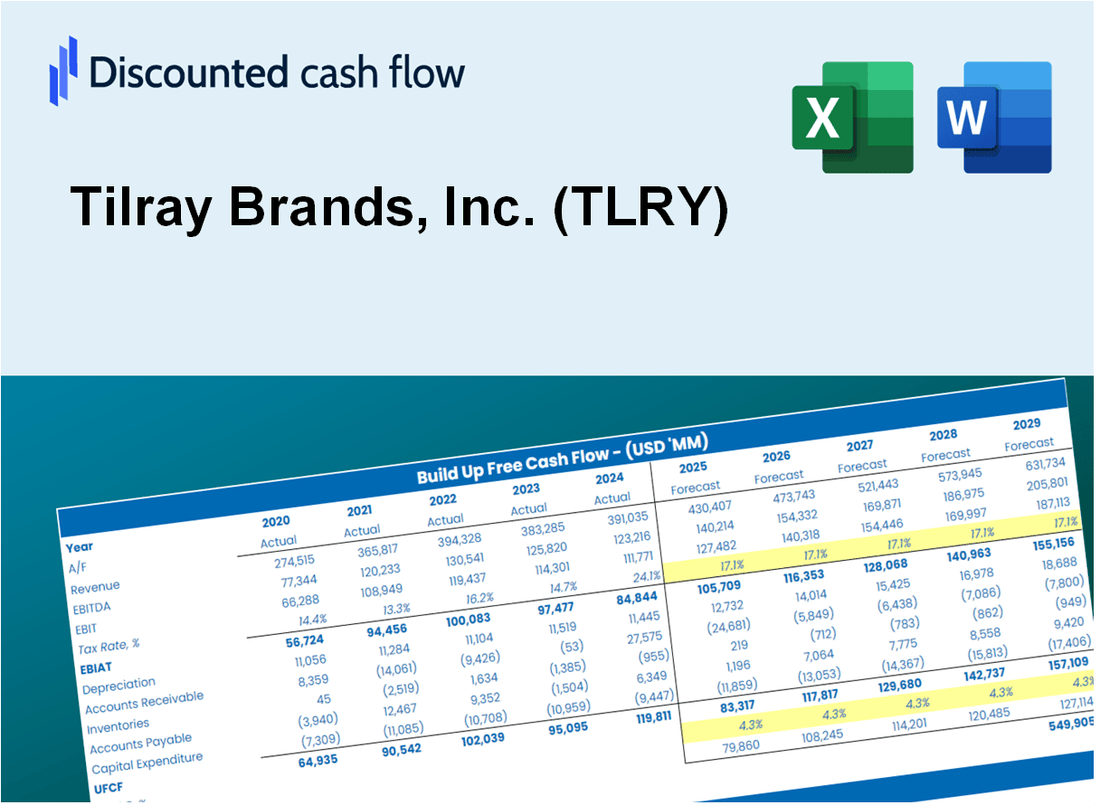
Valoración DCF de Tilray Brands, Inc. (TLRY) |
Completamente Editable: Adáptelo A Sus Necesidades En Excel O Sheets
Diseño Profesional: Plantillas Confiables Y Estándares De La Industria
Predeterminadas Para Un Uso Rápido Y Eficiente
Compatible con MAC / PC, completamente desbloqueado
No Se Necesita Experiencia; Fáciles De Seguir
Tilray Brands, Inc. (TLRY) Bundle
¡Mejore sus opciones de inversión con la calculadora DCF de Tilray Brands, Inc. (TLRY)! Revise los datos financieros reales para Tilray, ajuste las proyecciones y gastos de crecimiento, y observe cómo estas modificaciones afectan el valor intrínseco de las marcas Tilray en tiempo real.
What You Will Get
- Real Tilray Data: Preloaded financials – from revenue to EBIT – based on actual and projected figures for Tilray Brands, Inc. (TLRY).
- Full Customization: Adjust all critical parameters (yellow cells) like WACC, growth %, and tax rates specific to Tilray.
- Instant Valuation Updates: Automatic recalculations to analyze the impact of changes on Tilray’s fair value.
- Versatile Excel Template: Tailored for quick edits, scenario testing, and detailed projections for Tilray Brands, Inc. (TLRY).
- Time-Saving and Accurate: Skip building models from scratch while maintaining precision and flexibility in your analyses.
Key Features
- Customizable Growth Metrics: Adjust essential factors such as sales growth, operating margin, and investment in R&D.
- Instant DCF Analysis: Quickly computes intrinsic value, net present value, and additional financial metrics.
- High-Precision Valuation: Leverages Tilray's actual financial data for accurate valuation results.
- Effortless Scenario Testing: Easily explore various assumptions and assess their impact on results.
- Efficiency Booster: Streamlines the process by removing the need for intricate valuation models from the ground up.
How It Works
- Step 1: Download the Excel file.
- Step 2: Review pre-entered Tilray Brands, Inc. (TLRY) data (historical and projected).
- Step 3: Adjust key assumptions (yellow cells) based on your analysis.
- Step 4: View automatic recalculations for Tilray Brands, Inc. (TLRY)’s intrinsic value.
- Step 5: Use the outputs for investment decisions or reporting.
Why Choose This Calculator for Tilray Brands, Inc. (TLRY)?
- Accurate Data: Up-to-date Tilray financials provide dependable valuation outcomes.
- Customizable: Modify essential parameters such as growth rates, WACC, and tax rates to align with your forecasts.
- Time-Saving: Built-in calculations save you from starting from scratch.
- Professional-Grade Tool: Tailored for investors, analysts, and consultants in the cannabis industry.
- User-Friendly: Easy-to-navigate design and clear instructions make it accessible for all users.
Who Should Use This Product?
- Finance Students: Understand cannabis market dynamics and valuation methods using real data.
- Academics: Integrate industry-specific models into research or teaching materials.
- Investors: Evaluate your investment strategies and assess valuation metrics for Tilray Brands, Inc. (TLRY).
- Analysts: Enhance your analysis with a customizable DCF model tailored for the cannabis sector.
- Small Business Owners: Discover how large cannabis firms like Tilray are valued and analyzed in the market.
What the Template Contains
- Operating and Balance Sheet Data: Pre-filled Tilray Brands, Inc. (TLRY) historical data and forecasts, including revenue, EBITDA, EBIT, and capital expenditures.
- WACC Calculation: A dedicated sheet for Weighted Average Cost of Capital (WACC), including parameters like Beta, risk-free rate, and share price.
- DCF Valuation (Unlevered and Levered): Editable Discounted Cash Flow models showing intrinsic value with detailed calculations.
- Financial Statements: Pre-loaded financial statements (annual and quarterly) to support analysis.
- Key Ratios: Includes profitability, leverage, and efficiency ratios for Tilray Brands, Inc. (TLRY).
- Dashboard and Charts: Visual summary of valuation outputs and assumptions to analyze results easily.
Disclaimer
All information, articles, and product details provided on this website are for general informational and educational purposes only. We do not claim any ownership over, nor do we intend to infringe upon, any trademarks, copyrights, logos, brand names, or other intellectual property mentioned or depicted on this site. Such intellectual property remains the property of its respective owners, and any references here are made solely for identification or informational purposes, without implying any affiliation, endorsement, or partnership.
We make no representations or warranties, express or implied, regarding the accuracy, completeness, or suitability of any content or products presented. Nothing on this website should be construed as legal, tax, investment, financial, medical, or other professional advice. In addition, no part of this site—including articles or product references—constitutes a solicitation, recommendation, endorsement, advertisement, or offer to buy or sell any securities, franchises, or other financial instruments, particularly in jurisdictions where such activity would be unlawful.
All content is of a general nature and may not address the specific circumstances of any individual or entity. It is not a substitute for professional advice or services. Any actions you take based on the information provided here are strictly at your own risk. You accept full responsibility for any decisions or outcomes arising from your use of this website and agree to release us from any liability in connection with your use of, or reliance upon, the content or products found herein.