
|
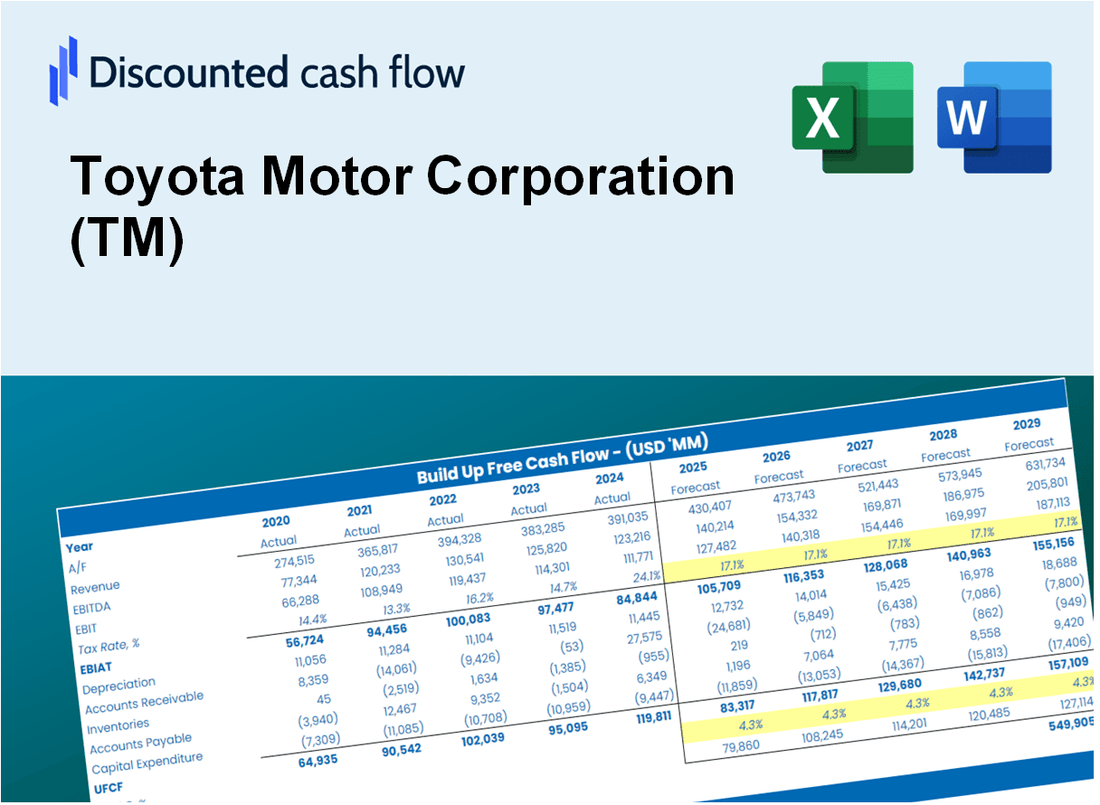
Valoración DCF de Toyota Motor Corporation (TM) |
Completamente Editable: Adáptelo A Sus Necesidades En Excel O Sheets
Diseño Profesional: Plantillas Confiables Y Estándares De La Industria
Predeterminadas Para Un Uso Rápido Y Eficiente
Compatible con MAC / PC, completamente desbloqueado
No Se Necesita Experiencia; Fáciles De Seguir
Toyota Motor Corporation (TM) Bundle
¿Busca determinar el valor intrínseco de Toyota Motor Corporation? Nuestra calculadora DCF (TM) integra datos del mundo real con extensas características de personalización, lo que le permite ajustar los pronósticos y mejorar sus estrategias de inversión.
Discounted Cash Flow (DCF) - (USD MM)
| Year | AY1 2021 |
AY2 2022 |
AY3 2023 |
AY4 2024 |
AY5 2025 |
FY1 2026 |
FY2 2027 |
FY3 2028 |
FY4 2029 |
FY5 2030 |
|---|---|---|---|---|---|---|---|---|---|---|
| Revenue | 176,077.5 | 203,024.3 | 240,387.0 | 291,765.2 | 310,795.8 | 358,660.5 | 413,896.6 | 477,639.5 | 551,199.3 | 636,087.7 |
| Revenue Growth, % | 0 | 15.3 | 18.4 | 21.37 | 6.52 | 15.4 | 15.4 | 15.4 | 15.4 | 15.4 |
| EBITDA | 29,885.2 | 37,816.1 | 37,241.1 | 58,985.9 | 56,611.7 | 64,216.9 | 74,106.8 | 85,519.7 | 98,690.3 | 113,889.3 |
| EBITDA, % | 16.97 | 18.63 | 15.49 | 20.22 | 18.22 | 17.9 | 17.9 | 17.9 | 17.9 | 17.9 |
| Depreciation | 10,638.5 | 11,787.5 | 13,198.1 | 13,503.2 | 14,565.4 | 19,118.7 | 22,063.1 | 25,460.9 | 29,382.1 | 33,907.1 |
| Depreciation, % | 6.04 | 5.81 | 5.49 | 4.63 | 4.69 | 5.33 | 5.33 | 5.33 | 5.33 | 5.33 |
| EBIT | 19,246.7 | 26,028.6 | 24,043.0 | 45,482.7 | 42,046.3 | 45,098.3 | 52,043.7 | 60,058.8 | 69,308.3 | 79,982.2 |
| EBIT, % | 10.93 | 12.82 | 10 | 15.59 | 13.53 | 12.57 | 12.57 | 12.57 | 12.57 | 12.57 |
| Total Cash | 60,276.2 | 55,776.9 | 59,734.9 | 91,318.6 | 102,990.0 | 108,309.3 | 124,989.7 | 144,239.0 | 166,452.7 | 192,087.6 |
| Total Cash, percent | .0 | .0 | .0 | .0 | .0 | .0 | .0 | .0 | .0 | .0 |
| Account Receivables | 63,582.9 | 67,857.5 | 78,187.2 | 96,813.9 | 99,310.7 | 119,932.8 | 138,403.3 | 159,718.3 | 184,316.0 | 212,701.9 |
| Account Receivables, % | 36.11 | 33.42 | 32.53 | 33.18 | 31.95 | 33.44 | 33.44 | 33.44 | 33.44 | 33.44 |
| Inventories | 18,685.4 | 24,724.0 | 27,533.7 | 29,796.6 | 29,750.4 | 38,755.9 | 44,724.6 | 51,612.5 | 59,561.1 | 68,733.9 |
| Inventories, % | 10.61 | 12.18 | 11.45 | 10.21 | 9.57 | 10.81 | 10.81 | 10.81 | 10.81 | 10.81 |
| Accounts Payable | 19,110.4 | 20,497.4 | 24,711.0 | 24,767.5 | 26,105.8 | 34,515.8 | 39,831.4 | 45,965.7 | 53,044.8 | 61,214.0 |
| Accounts Payable, % | 10.85 | 10.1 | 10.28 | 8.49 | 8.4 | 9.62 | 9.62 | 9.62 | 9.62 | 9.62 |
| Capital Expenditure | -24,378.5 | -24,781.5 | -23,976.6 | -32,662.9 | -34,018.6 | -41,723.9 | -48,149.6 | -55,565.0 | -64,122.4 | -73,997.7 |
| Capital Expenditure, % | -13.85 | -12.21 | -9.97 | -11.19 | -10.95 | -11.63 | -11.63 | -11.63 | -11.63 | -11.63 |
| Tax Rate, % | 25.71 | 25.71 | 25.71 | 25.71 | 25.71 | 25.71 | 25.71 | 25.71 | 25.71 | 25.71 |
| EBITAT | 14,736.9 | 18,590.1 | 16,064.7 | 32,290.9 | 31,234.2 | 32,478.7 | 37,480.6 | 43,252.9 | 49,914.1 | 57,601.3 |
| Depreciation | ||||||||||
| Changes in Account Receivables | ||||||||||
| Changes in Inventories | ||||||||||
| Changes in Accounts Payable | ||||||||||
| Capital Expenditure | ||||||||||
| UFCF | -62,160.9 | -3,330.3 | -3,639.6 | -7,701.9 | 10,668.6 | -11,344.1 | -7,729.4 | -8,919.8 | -10,293.5 | -11,878.8 |
| WACC, % | 3.05 | 2.88 | 2.72 | 2.86 | 2.97 | 2.9 | 2.9 | 2.9 | 2.9 | 2.9 |
| PV UFCF | ||||||||||
| SUM PV UFCF | -45,992.9 | |||||||||
| Long Term Growth Rate, % | 2.00 | |||||||||
| Free cash flow (T + 1) | -12,116 | |||||||||
| Terminal Value | -1,350,657 | |||||||||
| Present Terminal Value | -1,170,927 | |||||||||
| Enterprise Value | -1,216,920 | |||||||||
| Net Debt | 192,873 | |||||||||
| Equity Value | -1,409,793 | |||||||||
| Diluted Shares Outstanding, MM | 131 | |||||||||
| Equity Value Per Share | -10,750.94 |
What You Will Get
- Real TM Financial Data: Pre-filled with Toyota’s historical and projected data for precise analysis.
- Fully Editable Template: Modify key inputs like revenue growth, WACC, and EBITDA % with ease.
- Automatic Calculations: See Toyota’s intrinsic value update instantly based on your changes.
- Professional Valuation Tool: Designed for investors, analysts, and consultants seeking accurate DCF results.
- User-Friendly Design: Simple structure and clear instructions for all experience levels.
Key Features
- Pre-Loaded Data: Toyota’s historical financial statements and pre-filled forecasts.
- Fully Adjustable Inputs: Modify WACC, tax rates, revenue growth, and EBITDA margins.
- Instant Results: View Toyota’s intrinsic value recalculating in real time.
- Clear Visual Outputs: Dashboard charts showcase valuation results and key metrics.
- Built for Accuracy: A professional tool designed for analysts, investors, and finance experts.
How It Works
- Step 1: Download the Excel file.
- Step 2: Review Toyota’s pre-filled financial data and forecasts.
- Step 3: Modify critical inputs like revenue growth, WACC, and tax rates (highlighted cells).
- Step 4: Watch the DCF model update instantly as you tweak assumptions.
- Step 5: Analyze the outputs and use the results for investment decisions.
Why Choose Toyota Motor Corporation (TM)?
- Innovative Technology: Experience cutting-edge advancements in automotive engineering.
- Exceptional Reliability: Dependable vehicles known for their durability and longevity.
- Environmental Commitment: Leading the way in hybrid and electric vehicle development.
- Customer Satisfaction: Consistently high ratings for quality and service from drivers worldwide.
- Global Presence: A trusted brand with a strong reputation in markets around the globe.
Who Should Use This Product?
- Professional Investors: Develop comprehensive and accurate valuation models for assessing Toyota Motor Corporation (TM).
- Corporate Finance Teams: Evaluate valuation scenarios to inform strategic decisions within the organization.
- Consultants and Advisors: Deliver precise valuation insights to clients regarding Toyota Motor Corporation (TM).
- Students and Educators: Utilize real-world data to enhance learning and practice in financial modeling.
- Automotive Enthusiasts: Gain insights into how automotive companies like Toyota Motor Corporation (TM) are valued in the market.
What the Template Contains
- Pre-Filled Data: Includes Toyota Motor Corporation’s historical financials and forecasts.
- Discounted Cash Flow Model: Editable DCF valuation model with automatic calculations.
- Weighted Average Cost of Capital (WACC): A dedicated sheet for calculating WACC based on custom inputs.
- Key Financial Ratios: Analyze Toyota’s profitability, efficiency, and leverage.
- Customizable Inputs: Edit revenue growth, margins, and tax rates with ease.
- Clear Dashboard: Charts and tables summarizing key valuation results.
Disclaimer
All information, articles, and product details provided on this website are for general informational and educational purposes only. We do not claim any ownership over, nor do we intend to infringe upon, any trademarks, copyrights, logos, brand names, or other intellectual property mentioned or depicted on this site. Such intellectual property remains the property of its respective owners, and any references here are made solely for identification or informational purposes, without implying any affiliation, endorsement, or partnership.
We make no representations or warranties, express or implied, regarding the accuracy, completeness, or suitability of any content or products presented. Nothing on this website should be construed as legal, tax, investment, financial, medical, or other professional advice. In addition, no part of this site—including articles or product references—constitutes a solicitation, recommendation, endorsement, advertisement, or offer to buy or sell any securities, franchises, or other financial instruments, particularly in jurisdictions where such activity would be unlawful.
All content is of a general nature and may not address the specific circumstances of any individual or entity. It is not a substitute for professional advice or services. Any actions you take based on the information provided here are strictly at your own risk. You accept full responsibility for any decisions or outcomes arising from your use of this website and agree to release us from any liability in connection with your use of, or reliance upon, the content or products found herein.