
|
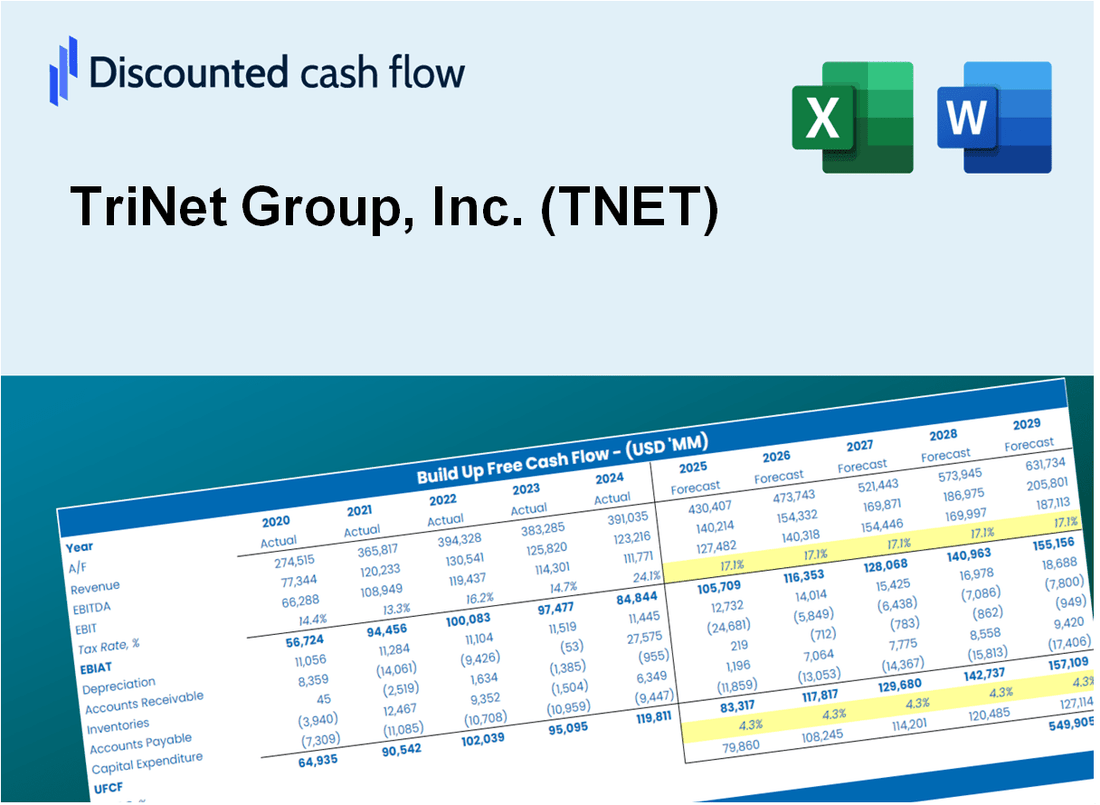
Valoración DCF de TriNet Group, Inc. (TNET) |
Completamente Editable: Adáptelo A Sus Necesidades En Excel O Sheets
Diseño Profesional: Plantillas Confiables Y Estándares De La Industria
Predeterminadas Para Un Uso Rápido Y Eficiente
Compatible con MAC / PC, completamente desbloqueado
No Se Necesita Experiencia; Fáciles De Seguir
TriNet Group, Inc. (TNET) Bundle
Diseñada para la precisión, nuestra calculadora DCF (TNET) le permite evaluar la valoración de Trinet Group, Inc. utilizando datos financieros del mundo real, al tiempo que ofrece una flexibilidad completa para modificar todos los parámetros esenciales para mejorar las proyecciones.
Discounted Cash Flow (DCF) - (USD MM)
| Year | AY1 2020 |
AY2 2021 |
AY3 2022 |
AY4 2023 |
AY5 2024 |
FY1 2025 |
FY2 2026 |
FY3 2027 |
FY4 2028 |
FY5 2029 |
|---|---|---|---|---|---|---|---|---|---|---|
| Revenue | 4,034.0 | 4,540.0 | 4,885.0 | 4,922.0 | 5,053.0 | 5,350.6 | 5,665.8 | 5,999.5 | 6,352.9 | 6,727.2 |
| Revenue Growth, % | 0 | 12.54 | 7.6 | 0.75742 | 2.66 | 5.89 | 5.89 | 5.89 | 5.89 | 5.89 |
| EBITDA | 446.0 | 520.0 | 610.0 | 662.0 | 363.0 | 595.3 | 630.4 | 667.5 | 706.8 | 748.5 |
| EBITDA, % | 11.06 | 11.45 | 12.49 | 13.45 | 7.18 | 11.13 | 11.13 | 11.13 | 11.13 | 11.13 |
| Depreciation | 47.0 | 59.0 | 89.0 | 121.0 | 75.0 | 88.1 | 93.2 | 98.7 | 104.6 | 110.7 |
| Depreciation, % | 1.17 | 1.3 | 1.82 | 2.46 | 1.48 | 1.65 | 1.65 | 1.65 | 1.65 | 1.65 |
| EBIT | 399.0 | 461.0 | 521.0 | 541.0 | 288.0 | 507.3 | 537.1 | 568.8 | 602.3 | 637.8 |
| EBIT, % | 9.89 | 10.15 | 10.67 | 10.99 | 5.7 | 9.48 | 9.48 | 9.48 | 9.48 | 9.48 |
| Total Cash | 358.0 | 747.0 | 430.0 | 352.0 | 360.0 | 518.0 | 548.5 | 580.8 | 615.1 | 651.3 |
| Total Cash, percent | .0 | .0 | .0 | .0 | .0 | .0 | .0 | .0 | .0 | .0 |
| Account Receivables | 264.0 | 339.0 | 394.0 | 465.0 | 381.0 | 418.0 | 442.7 | 468.7 | 496.3 | 525.6 |
| Account Receivables, % | 6.54 | 7.47 | 8.07 | 9.45 | 7.54 | 7.81 | 7.81 | 7.81 | 7.81 | 7.81 |
| Inventories | 1,451.0 | 1,262.0 | 1,334.0 | .0 | .0 | 974.6 | 1,032.0 | 1,092.8 | 1,157.2 | 1,225.3 |
| Inventories, % | 35.97 | 27.8 | 27.31 | 0 | 0 | 18.21 | 18.21 | 18.21 | 18.21 | 18.21 |
| Accounts Payable | 50.0 | 86.0 | 98.0 | 87.0 | 89.0 | 92.8 | 98.2 | 104.0 | 110.1 | 116.6 |
| Accounts Payable, % | 1.24 | 1.89 | 2.01 | 1.77 | 1.76 | 1.73 | 1.73 | 1.73 | 1.73 | 1.73 |
| Capital Expenditure | -36.0 | -40.0 | -56.0 | -75.0 | 2.0 | -47.6 | -50.4 | -53.3 | -56.5 | -59.8 |
| Capital Expenditure, % | -0.89241 | -0.88106 | -1.15 | -1.52 | 0.03958045 | -0.88872 | -0.88872 | -0.88872 | -0.88872 | -0.88872 |
| Tax Rate, % | 23.45 | 23.45 | 23.45 | 23.45 | 23.45 | 23.45 | 23.45 | 23.45 | 23.45 | 23.45 |
| EBITAT | 304.0 | 353.3 | 383.7 | 404.9 | 220.5 | 383.4 | 406.0 | 429.9 | 455.2 | 482.0 |
| Depreciation | ||||||||||
| Changes in Account Receivables | ||||||||||
| Changes in Inventories | ||||||||||
| Changes in Accounts Payable | ||||||||||
| Capital Expenditure | ||||||||||
| UFCF | -1,350.0 | 522.3 | 301.7 | 1,702.9 | 383.5 | -584.0 | 372.3 | 394.2 | 417.4 | 442.0 |
| WACC, % | 6.85 | 6.86 | 6.81 | 6.83 | 6.86 | 6.84 | 6.84 | 6.84 | 6.84 | 6.84 |
| PV UFCF | ||||||||||
| SUM PV UFCF | 740.7 | |||||||||
| Long Term Growth Rate, % | 1.00 | |||||||||
| Free cash flow (T + 1) | 446 | |||||||||
| Terminal Value | 7,645 | |||||||||
| Present Terminal Value | 5,492 | |||||||||
| Enterprise Value | 6,232 | |||||||||
| Net Debt | 662 | |||||||||
| Equity Value | 5,570 | |||||||||
| Diluted Shares Outstanding, MM | 50 | |||||||||
| Equity Value Per Share | 111.41 |
What You Will Get
- Pre-Filled Financial Model: TriNet Group’s actual data enables precise DCF valuation.
- Full Forecast Control: Adjust revenue growth, margins, WACC, and other key drivers.
- Instant Calculations: Automatic updates ensure you see results as you make changes.
- Investor-Ready Template: A refined Excel file designed for professional-grade valuation.
- Customizable and Reusable: Tailored for flexibility, allowing repeated use for detailed forecasts.
Key Features
- 🔍 Real-Life TNET Financials: Pre-filled historical and projected data for TriNet Group, Inc. (TNET).
- ✏️ Fully Customizable Inputs: Adjust all critical parameters (yellow cells) like WACC, growth %, and tax rates.
- 📊 Professional DCF Valuation: Built-in formulas calculate TriNet's intrinsic value using the Discounted Cash Flow method.
- ⚡ Instant Results: Visualize TriNet's valuation instantly after making changes.
- Scenario Analysis: Test and compare outcomes for various financial assumptions side-by-side.
How It Works
- Step 1: Download the Excel file.
- Step 2: Review TriNet Group, Inc.'s pre-filled financial data and forecasts.
- Step 3: Modify key inputs such as revenue growth, WACC, and tax rates (highlighted cells).
- Step 4: Observe the DCF model update in real-time as you adjust assumptions.
- Step 5: Analyze the outputs and leverage the results for investment decisions.
Why Choose This Calculator?
- Designed for Experts: A sophisticated tool utilized by financial analysts, CFOs, and business consultants.
- Accurate Financial Data: TriNet Group’s historical and forecasted financials preloaded for precision.
- Flexible Scenario Analysis: Easily test various forecasts and assumptions.
- Comprehensive Outputs: Automatically computes intrinsic value, NPV, and essential financial metrics.
- User-Friendly: Step-by-step guidance simplifies the entire process.
Who Should Use This Product?
- Investors: Evaluate TriNet Group, Inc.'s (TNET) market position before making investment decisions.
- CFOs and Financial Analysts: Optimize financial assessments and validate forecasts related to TriNet Group, Inc. (TNET).
- Startup Founders: Gain insights into the valuation methodologies applied to established companies like TriNet Group, Inc. (TNET).
- Consultants: Create comprehensive valuation reports for clients based on TriNet Group, Inc. (TNET) data.
- Students and Educators: Utilize real-time data from TriNet Group, Inc. (TNET) to enhance learning and teaching of valuation strategies.
What the Template Contains
- Pre-Filled Data: Includes TriNet Group, Inc.'s (TNET) historical financials and forecasts.
- Discounted Cash Flow Model: Editable DCF valuation model with automatic calculations for TriNet Group, Inc. (TNET).
- Weighted Average Cost of Capital (WACC): A dedicated sheet for calculating WACC based on custom inputs specific to TriNet Group, Inc. (TNET).
- Key Financial Ratios: Analyze TriNet Group, Inc.'s (TNET) profitability, efficiency, and leverage.
- Customizable Inputs: Edit revenue growth, margins, and tax rates for TriNet Group, Inc. (TNET) with ease.
- Clear Dashboard: Charts and tables summarizing key valuation results for TriNet Group, Inc. (TNET).
Disclaimer
All information, articles, and product details provided on this website are for general informational and educational purposes only. We do not claim any ownership over, nor do we intend to infringe upon, any trademarks, copyrights, logos, brand names, or other intellectual property mentioned or depicted on this site. Such intellectual property remains the property of its respective owners, and any references here are made solely for identification or informational purposes, without implying any affiliation, endorsement, or partnership.
We make no representations or warranties, express or implied, regarding the accuracy, completeness, or suitability of any content or products presented. Nothing on this website should be construed as legal, tax, investment, financial, medical, or other professional advice. In addition, no part of this site—including articles or product references—constitutes a solicitation, recommendation, endorsement, advertisement, or offer to buy or sell any securities, franchises, or other financial instruments, particularly in jurisdictions where such activity would be unlawful.
All content is of a general nature and may not address the specific circumstances of any individual or entity. It is not a substitute for professional advice or services. Any actions you take based on the information provided here are strictly at your own risk. You accept full responsibility for any decisions or outcomes arising from your use of this website and agree to release us from any liability in connection with your use of, or reliance upon, the content or products found herein.