
|
Valoración DCF de Top Ships Inc. (TOPS) |
Completamente Editable: Adáptelo A Sus Necesidades En Excel O Sheets
Diseño Profesional: Plantillas Confiables Y Estándares De La Industria
Predeterminadas Para Un Uso Rápido Y Eficiente
Compatible con MAC / PC, completamente desbloqueado
No Se Necesita Experiencia; Fáciles De Seguir
Top Ships Inc. (TOPS) Bundle
¡Mejore sus estrategias de inversión con la calculadora DCF Top Ships Inc. (TOPS)! Utilice datos financieros genuinos de los buques superiores, ajuste las predicciones y gastos de crecimiento, y observe instantáneamente cómo estas modificaciones afectan el valor intrínseco de Top Ships Inc. (TOPS).
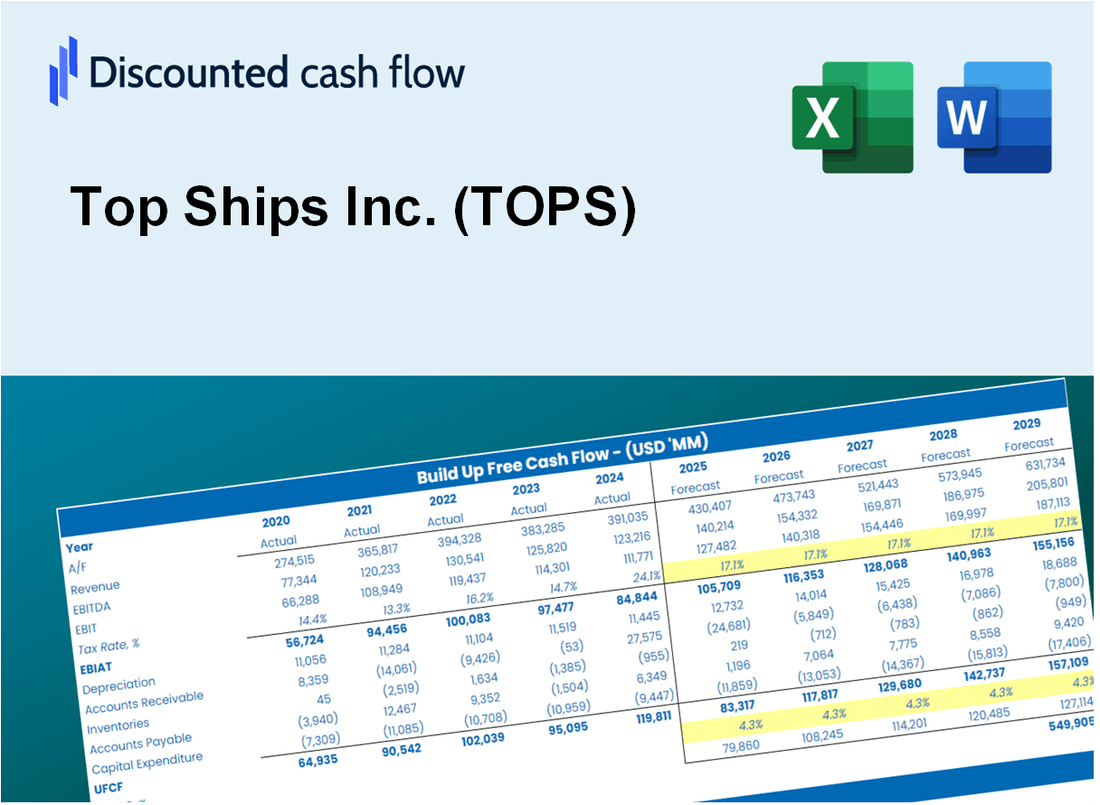
Discounted Cash Flow (DCF) - (USD MM)
| Year | AY1 2020 |
AY2 2021 |
AY3 2022 |
AY4 2023 |
AY5 2024 |
FY1 2025 |
FY2 2026 |
FY3 2027 |
FY4 2028 |
FY5 2029 |
|---|---|---|---|---|---|---|---|---|---|---|
| Revenue | 60.2 | 56.4 | 80.7 | 82.9 | 86.1 | 95.5 | 105.8 | 117.3 | 130.0 | 144.1 |
| Revenue Growth, % | 0 | -6.4 | 43.09 | 2.84 | 3.83 | 10.84 | 10.84 | 10.84 | 10.84 | 10.84 |
| EBITDA | 11.1 | 23.6 | 44.0 | 42.1 | 50.0 | 42.7 | 47.4 | 52.5 | 58.2 | 64.5 |
| EBITDA, % | 18.46 | 41.95 | 54.49 | 50.75 | 58.11 | 44.75 | 44.75 | 44.75 | 44.75 | 44.75 |
| Depreciation | 13.2 | 7.7 | 13.3 | 14.3 | 23.1 | 18.4 | 20.4 | 22.6 | 25.0 | 27.7 |
| Depreciation, % | 21.94 | 13.63 | 16.48 | 17.3 | 26.87 | 19.24 | 19.24 | 19.24 | 19.24 | 19.24 |
| EBIT | -2.1 | 16.0 | 30.7 | 27.7 | 26.9 | 24.3 | 27.0 | 29.9 | 33.2 | 36.8 |
| EBIT, % | -3.48 | 28.32 | 38.01 | 33.45 | 31.24 | 25.51 | 25.51 | 25.51 | 25.51 | 25.51 |
| Total Cash | 19.3 | 2.4 | 20.5 | 36.0 | 7.6 | 21.8 | 24.1 | 26.7 | 29.6 | 32.8 |
| Total Cash, percent | .0 | .0 | .0 | .0 | .0 | .0 | .0 | .0 | .0 | .0 |
| Account Receivables | .0 | .1 | .0 | .3 | 1.1 | .3 | .4 | .4 | .5 | .5 |
| Account Receivables, % | 0 | 0.13483 | 0.00991867 | 0.38216 | 1.29 | 0.36384 | 0.36384 | 0.36384 | 0.36384 | 0.36384 |
| Inventories | .5 | .7 | 1.0 | .9 | 1.0 | 1.1 | 1.2 | 1.3 | 1.4 | 1.6 |
| Inventories, % | 0.85351 | 1.19 | 1.27 | 1.1 | 1.14 | 1.11 | 1.11 | 1.11 | 1.11 | 1.11 |
| Accounts Payable | 2.5 | 2.3 | 2.0 | 1.4 | 1.8 | 2.8 | 3.1 | 3.4 | 3.8 | 4.2 |
| Accounts Payable, % | 4.22 | 4.09 | 2.42 | 1.63 | 2.11 | 2.9 | 2.9 | 2.9 | 2.9 | 2.9 |
| Capital Expenditure | -120.8 | -115.5 | -216.7 | .0 | .0 | -57.3 | -63.5 | -70.4 | -78.0 | -86.5 |
| Capital Expenditure, % | -200.63 | -204.93 | -268.69 | 0 | 0 | -60 | -60 | -60 | -60 | -60 |
| Tax Rate, % | 0 | 0 | 0 | 0 | 0 | 0 | 0 | 0 | 0 | 0 |
| EBITAT | -2.1 | 16.0 | 30.7 | 27.7 | 26.9 | 24.3 | 27.0 | 29.9 | 33.2 | 36.8 |
| Depreciation | ||||||||||
| Changes in Account Receivables | ||||||||||
| Changes in Inventories | ||||||||||
| Changes in Accounts Payable | ||||||||||
| Capital Expenditure | ||||||||||
| UFCF | -107.7 | -92.3 | -173.4 | 41.3 | 49.7 | -12.9 | -16.0 | -17.7 | -19.6 | -21.8 |
| WACC, % | 9.25 | 9.25 | 9.25 | 9.25 | 9.25 | 9.25 | 9.25 | 9.25 | 9.25 | 9.25 |
| PV UFCF | ||||||||||
| SUM PV UFCF | -66.6 | |||||||||
| Long Term Growth Rate, % | 0.50 | |||||||||
| Free cash flow (T + 1) | -22 | |||||||||
| Terminal Value | -250 | |||||||||
| Present Terminal Value | -161 | |||||||||
| Enterprise Value | -227 | |||||||||
| Net Debt | 244 | |||||||||
| Equity Value | -471 | |||||||||
| Diluted Shares Outstanding, MM | 5 | |||||||||
| Equity Value Per Share | -101.84 |
What You Will Get
- Real TOPS Financials: Access to historical and projected data for precise valuation.
- Customizable Inputs: Adjust WACC, tax rates, revenue growth, and capital expenditures as needed.
- Dynamic Calculations: Intrinsic value and NPV are computed in real-time.
- Scenario Analysis: Evaluate various scenarios to assess Top Ships Inc.'s future performance.
- User-Friendly Design: Designed for professionals while remaining approachable for newcomers.
Key Features
- Comprehensive DCF Calculator: Features detailed unlevered and levered DCF valuation models tailored for Top Ships Inc. (TOPS).
- WACC Calculator: Includes a pre-built Weighted Average Cost of Capital sheet with customizable parameters.
- Customizable Forecast Assumptions: Adjust growth rates, capital expenditures, and discount rates to fit your analysis.
- Integrated Financial Ratios: Evaluate profitability, leverage, and efficiency ratios specific to Top Ships Inc. (TOPS).
- Visual Dashboard and Charts: Graphical representations provide a clear summary of key valuation metrics for straightforward analysis.
How It Works
- Download: Get the pre-prepared Excel file containing Top Ships Inc.'s (TOPS) financial data.
- Customize: Modify projections, such as revenue growth, EBITDA %, and WACC.
- Update Automatically: The intrinsic value and NPV calculations refresh in real-time.
- Test Scenarios: Develop various forecasts and instantly compare results.
- Make Decisions: Leverage the valuation findings to inform your investment approach.
Why Choose This Calculator for Top Ships Inc. (TOPS)?
- User-Friendly Interface: Perfect for both novice and seasoned users.
- Customizable Inputs: Modify parameters easily to suit your analysis needs.
- Real-Time Insights: Witness immediate updates on Top Ships Inc. (TOPS) valuation as you change inputs.
- Preloaded Data: Comes with Top Ships Inc. (TOPS) actual financial metrics for fast evaluations.
- Preferred by Experts: A go-to tool for investors and analysts for making well-informed choices.
Who Should Use This Product?
- Finance Students: Explore maritime industry valuation techniques and apply them to Top Ships Inc. (TOPS) using real data.
- Academics: Integrate advanced financial models into your coursework or research focused on shipping and logistics.
- Investors: Validate your investment strategies and analyze valuation scenarios for Top Ships Inc. (TOPS).
- Analysts: Enhance your analysis with a customizable DCF model tailored for the maritime sector.
- Small Business Owners: Understand how publicly traded companies like Top Ships Inc. (TOPS) are evaluated in the market.
What the Template Contains
- Historical Data: Includes Top Ships Inc.'s (TOPS) past financials and baseline forecasts.
- DCF and Levered DCF Models: Detailed templates to calculate Top Ships Inc.'s (TOPS) intrinsic value.
- WACC Sheet: Pre-built calculations for Weighted Average Cost of Capital.
- Editable Inputs: Modify key drivers like growth rates, EBITDA %, and CAPEX assumptions.
- Quarterly and Annual Statements: A complete breakdown of Top Ships Inc.'s (TOPS) financials.
- Interactive Dashboard: Visualize valuation results and projections dynamically.
Disclaimer
All information, articles, and product details provided on this website are for general informational and educational purposes only. We do not claim any ownership over, nor do we intend to infringe upon, any trademarks, copyrights, logos, brand names, or other intellectual property mentioned or depicted on this site. Such intellectual property remains the property of its respective owners, and any references here are made solely for identification or informational purposes, without implying any affiliation, endorsement, or partnership.
We make no representations or warranties, express or implied, regarding the accuracy, completeness, or suitability of any content or products presented. Nothing on this website should be construed as legal, tax, investment, financial, medical, or other professional advice. In addition, no part of this site—including articles or product references—constitutes a solicitation, recommendation, endorsement, advertisement, or offer to buy or sell any securities, franchises, or other financial instruments, particularly in jurisdictions where such activity would be unlawful.
All content is of a general nature and may not address the specific circumstances of any individual or entity. It is not a substitute for professional advice or services. Any actions you take based on the information provided here are strictly at your own risk. You accept full responsibility for any decisions or outcomes arising from your use of this website and agree to release us from any liability in connection with your use of, or reliance upon, the content or products found herein.