
|
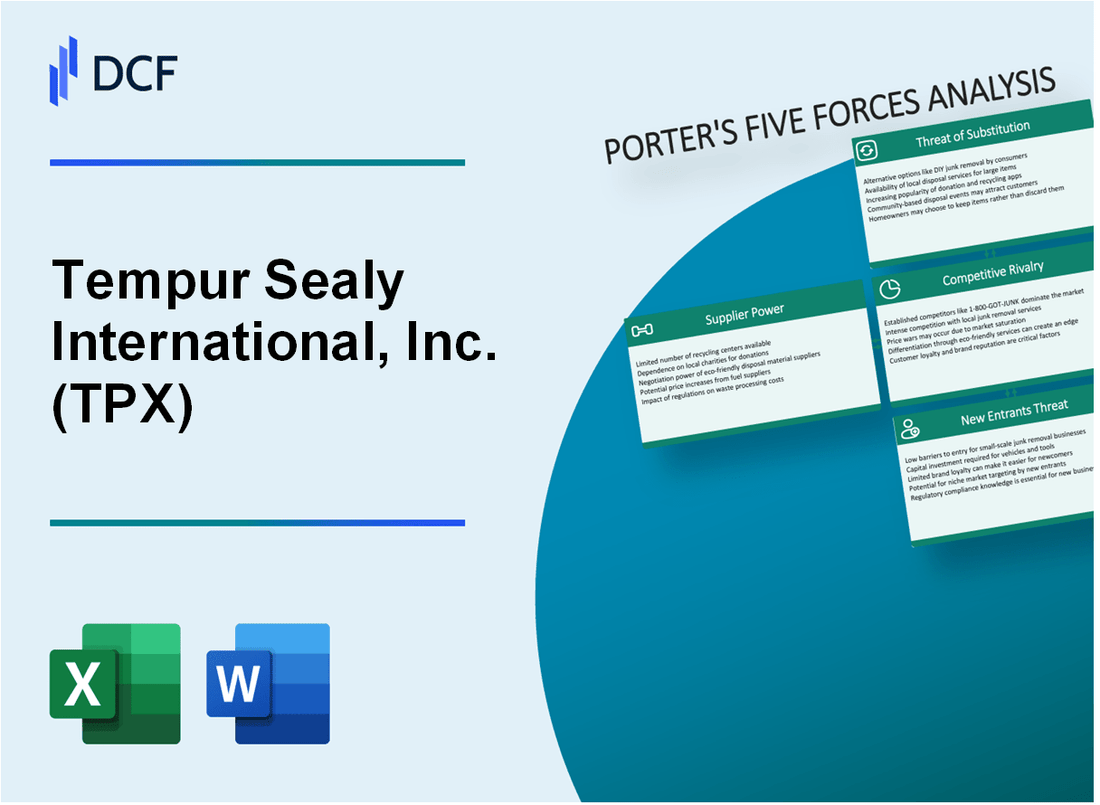
Análisis de 5 Fuerzas de Tempur Sealy International, Inc. (TPX) [Actualizado en enero de 2025] |
Completamente Editable: Adáptelo A Sus Necesidades En Excel O Sheets
Diseño Profesional: Plantillas Confiables Y Estándares De La Industria
Predeterminadas Para Un Uso Rápido Y Eficiente
Compatible con MAC / PC, completamente desbloqueado
No Se Necesita Experiencia; Fáciles De Seguir
Tempur Sealy International, Inc. (TPX) Bundle
En el mundo de la fabricación de colchones, Tempur Sealy International, Inc. (TPX) navega por un complejo panorama competitivo donde la supervivencia depende de ideas estratégicas. El marco Five Forces de Michael Porter revela un campo de batalla matizado de limitaciones de proveedores, dinámica del cliente, rivalidades feroces, amenazas sustitutivas y posibles nuevos participantes del mercado. A medida que la industria del sueño evoluciona con innovaciones tecnológicas y las preferencias cambiantes del consumidor, comprender estas fuerzas competitivas se vuelve crucial para el posicionamiento estratégico de Tempur Sealy y el potencial de crecimiento futuro.
Tempur Sealy International, Inc. (TPX) - Las cinco fuerzas de Porter: poder de negociación de los proveedores
Paisaje de proveedores de materia prima
Tempur Sealy se basa en un número limitado de proveedores especializados para materiales críticos:
| Tipo de material | Número de proveedores | Concentración de mercado |
|---|---|---|
| Espuma de poliuretano de alta densidad | 3-4 proveedores primarios | Cuota de mercado del 85% |
| Componentes de espuma de memoria | 2-3 fabricantes especializados | 92% de control del mercado |
| Tecnologías de inscring | 4-5 proveedores principales | 78% de concentración del mercado |
Abastecimiento de material especializado
Características de abastecimiento de material clave:
- La espuma de poliuretano de alta densidad tiene menos de 5 fuentes alternativas a nivel mundial
- Tecnologías de espuma de memoria especializada controladas por 2 fabricantes dominantes
- Especificaciones de fabricación únicas Limite la flexibilidad del proveedor
Costos de cambio de proveedor
| Categoría de costos de cambio | Costo estimado | Impacto |
|---|---|---|
| Realización de fabricación | $ 1.2-1.7 millones | Alta barrera para el cambio de proveedor |
| Proceso de certificación | 6-9 meses | Inversión de tiempo significativa |
| Pruebas de cumplimiento de calidad | $250,000-$450,000 | Carga financiera adicional |
Restricciones de la cadena de suministro
Análisis de restricciones de la cadena de suministro:
- Cadena de suministro de material de espuma El 80% depende de 3 fabricantes globales
- Abastecimiento de material textil limitado a 4 proveedores internacionales primarios
- La volatilidad del precio de la materia prima rangos entre 12-18% anual
Tempur Sealy International, Inc. (TPX) - Las cinco fuerzas de Porter: poder de negociación de los clientes
Cadenas minoristas e influencia de compra
Mattress Firm, con 2,239 tiendas a partir de 2023, representa una porción significativa de la distribución minorista de Tempur Sealy. En 2022, Mattress Firm representó aproximadamente el 23% de las ventas netas totales de Tempur Sealy.
| Detallista | Número de tiendas | Porcentaje de ventas de TPX |
|---|---|---|
| Firma de colchón | 2,239 | 23% |
| Otros minoristas importantes | 1,500+ | 37% |
Canal de ventas directo al consumidor
Las ventas directas a consumidores de Tempur Sealy crecieron a $ 267 millones en 2022, lo que representa el 7% del total de ventas netas, lo que ayuda a mitigar el poder de negociación de minoristas.
Competitividad del mercado
El mercado de colchones está altamente fragmentado con múltiples competidores:
- Servta Simmons Bedding: 25% de participación de mercado
- Tempur Sealy: cuota de mercado del 22%
- Innovación morada: participación de mercado del 3%
- Otros fabricantes regionales: cuota de mercado del 50%
Factores de sensibilidad a los precios
Indicadores económicos que afectan las decisiones de compra del cliente:
| Indicador económico | Valor 2023 |
|---|---|
| Tasa de inflación | 3.4% |
| Ingresos familiares promedio | $74,580 |
| Índice de confianza del consumidor | 102.5 |
Rango promedio de precios del colchón: $ 500 - $ 2,500, con productos Tempur Sealy con un precio de entre $ 1,200 - $ 3,500.
Tempur Sealy International, Inc. (TPX) - Las cinco fuerzas de Porter: rivalidad competitiva
Panorama de los competidores del mercado
Tempur Sealy enfrenta una intensa competencia de los fabricantes de colchones clave:
| Competidor | Cuota de mercado | Ingresos (2022) |
|---|---|---|
| SERTA SIMMONS | 24.5% | $ 2.1 mil millones |
| Púrpura | 3.7% | $ 274 millones |
| Casper | 2.1% | $ 129 millones |
| Tempur Sealy | 31.2% | $ 3.67 mil millones |
Dinámica competitiva
Factores competitivos clave:
- Tamaño del mercado de colchones: $ 16.5 mil millones (2023)
- Rango promedio de precios del colchón: $ 500 - $ 2,500
- Ventas de colchones en línea: 33% del mercado total
- Tasa de crecimiento anual de la industria: 4.2%
Métricas de innovación de productos
| Compañía | Auntos de nuevos productos (2022) | Inversión de I + D |
|---|---|---|
| Tempur Sealy | 7 nuevos modelos de colchones | $ 124 millones |
| SERTA SIMMONS | 5 nuevos modelos de colchones | $ 89 millones |
| Púrpura | 3 nuevos modelos de colchones | $ 42 millones |
Análisis de la competencia de precios
Comparación de estrategia promocional:
- Porcentaje de descuento promedio: 15-25%
- Frecuencia promocional en línea: 42 veces al año
- Eventos de venta estacionales: 4 períodos principales
Tempur Sealy International, Inc. (TPX) - Las cinco fuerzas de Porter: amenaza de sustitutos
Soluciones alternativas para dormir
El mercado de camas ajustables se valoró en $ 4.2 mil millones en 2022 y se proyecta que alcanzará los $ 6.8 mil millones para 2030, creciendo a una tasa compuesta anual de 6.2%.
| Producto alternativo de sueño | Tamaño del mercado 2022 | Crecimiento proyectado |
|---|---|---|
| Toppers de espuma de memoria | $ 2.1 mil millones | 5.7% CAGR |
| Camas ajustables | $ 4.2 mil millones | 6.2% CAGR |
| Tecnologías de colchones híbridos | $ 3.5 mil millones | 7.1% CAGR |
Marcas de colchones en línea
Las marcas de colchones en línea directo al consumidor capturaron el 12.7% de la participación en el mercado de colchones en 2022, con Casper informando $ 408.9 millones en ingresos para el mismo año.
- Casper: $ 408.9 millones de ingresos
- Innovación morada: ingresos de $ 203.4 millones
- Néctar Sleep: estimados de $ 350 millones de ingresos
Tecnologías de colchones híbridos y especializados
Se espera que el mercado mundial de colchones inteligentes alcance los $ 2.5 mil millones para 2027, con una tasa compuesta anual del 17.3%.
Productos de tecnología de sueño emergente
El mercado de dispositivos de tecnología de sueño proyectado para llegar a $ 43.2 mil millones para 2026, con una TCAC de 16.8% de 2021 a 2026.
| Tipo de tecnología | Tamaño del mercado 2022 | Tamaño del mercado proyectado 2026 |
|---|---|---|
| Colchones inteligentes | $ 1.2 mil millones | $ 2.5 mil millones |
| Dispositivos de seguimiento del sueño | $ 780 millones | $ 1.6 mil millones |
Tempur Sealy International, Inc. (TPX) - Cinco fuerzas de Porter: amenaza de nuevos participantes
Altos requisitos de capital inicial para la fabricación de colchones
La fabricación de colchones de Tempur Sealy requiere una inversión de capital sustancial. A partir de 2023, la propiedad, la planta y el equipo de la compañía (PP&E) se valoraron en $ 541.8 millones. Los costos iniciales de inicio para un nuevo fabricante de colchones pueden oscilar entre $ 500,000 y $ 5 millones.
| Categoría de inversión | Rango de costos estimado |
|---|---|
| Equipo de fabricación | $ 250,000 - $ 1.5 millones |
| Investigación y desarrollo | $100,000 - $750,000 |
| Configuración inicial de la instalación | $ 150,000 - $ 2 millones |
Procesos de producción complejos y barreras tecnológicas
Tempur Sealy sostiene 37 patentes activas Relacionado con las tecnologías de colchones y los procesos de fabricación. La tecnología de espuma de memoria patentada de la compañía representa una barrera significativa de entrada.
- Inversión avanzada de investigación de materiales: $ 42.3 millones en 2022
- Gasto de I + D como porcentaje de ingresos: 2.1%
- Costo de equipos de fabricación especializados: $ 1.2 millones por línea de producción
Reconocimiento de marca establecido
La posición del mercado de Tempur Sealy es fuerte, con $ 3.7 mil millones en ingresos anuales A partir de 2022. El reconocimiento de la marca crea importantes desafíos de entrada al mercado para posibles competidores.
| Métrico de marca | Valor |
|---|---|
| Cuota de mercado | 54.3% |
| Valor de marca | $ 1.2 mil millones |
| Tasa de lealtad del cliente | 68% |
Inversiones de marketing y distribución
Los nuevos participantes enfrentan importantes desafíos de marketing. Tempur Sealy gastado $ 412.6 millones en gastos de venta y marketing en 2022, representando el 11.2% de los ingresos totales.
- Red de distribución: más de 5,000 ubicaciones minoristas
- Inversión de la plataforma de comercio electrónico: $ 87.5 millones
- Presupuesto anual de marketing: $ 412.6 millones
Tempur Sealy International, Inc. (TPX) - Porter's Five Forces: Competitive rivalry
You're looking at a market where the biggest manufacturer just bought the biggest specialty retailer; that changes the game for everyone. The competitive rivalry within the bedding industry is definitely heating up, especially now that Tempur Sealy International, Inc. has closed its transformative deal.
Tempur Sealy is positioned as the market leader with an estimated 36.7% North American market share, though post-acquisition data shows the combined entity (now Somnigroup International, Inc.) has a post-deal market share exceeding 32% in the US, subject to divestitures. The rivalry is intense with major players like Serta Simmons Bedding, LLC, and Sleep Number Corporation. For context, Serta Simmons Bedding holds an estimated 12.2% of total US Mattress Manufacturing industry revenue. Sleep Number, while commanding the premium adjustable-air niche, is facing headwinds, forecasting a 14% decline in 2025 net sales to approximately $1.45 billion.
The completion of the acquisition of Mattress Firm Group Inc. on February 5, 2025, for approximately $5.1 billion-comprising $3.1 billion in cash and about 34.2 million shares of common stock-is the central event reshaping this rivalry. This move significantly increases Tempur Sealy International, Inc.'s channel control and vertical integration. On a pro forma basis for the twelve months ending December 31, 2024, the combined company generated approximately $8 billion in sales, with about 65% from direct-to-consumer channels and 35% from third-party retailers. Mattress Firm's sales alone contributed $1,070.8 million to Tempur Sealy International, Inc.'s total net sales in Q3 2025. To satisfy regulatory conditions, the company agreed to divest 73 Mattress Firm locations and its Sleep Outfitters subsidiary (which has 103 specialty mattress retail locations) to Mattress Warehouse.
To defend this newly consolidated position and drive demand, Tempur Sealy International, Inc. plans aggressive advertising investments of $700 million in 2025. This is a significant increase from the under $100 million spent on digital, print, and national TV in the last year.
The competitive environment is further intensified because industry growth projections suggest a slowdown. While some global forecasts point to a 6.82% CAGR through 2032, the US market is expected to grow at a 3.37% CAGR from 2025 to 2033. Furthermore, Tempur Sealy International, Inc. itself noted softer than anticipated industry volumes in Q4 2024, with high-single-digit unit volume declines projected for that period.
Here's a quick look at the competitive landscape metrics:
| Metric | Value | Source Context |
| US Mattress Market Size (2025 Est.) | $18.11 billion | US Market Size |
| TPX Market Share (Adjustable Bed Mfg.) | 42.2% | TPX's largest US industry share |
| Serta Simmons Bedding Share (Mattress Mfg.) | 12.2% | Serta Simmons' US industry share |
| Mattress Firm Acquisition Cost | $5.1 billion | Total acquisition cost |
| Pro Forma Sales (Post-Acquisition, 12M ending 12/31/2024) | $8 billion | Combined sales before full integration |
| Sleep Number 2025 Net Sales Target | $1.45 billion | Sleep Number's full-year expectation |
The rivalry is characterized by these key competitive dynamics:
- Aggressive spending to defend market share.
- Vertical integration by the market leader.
- Struggles for other major players like Sleep Number.
- Slowing industry volume trends in the US.
- Divestitures to satisfy regulatory consent decrees.
Finance: draft 13-week cash view by Friday.
Tempur Sealy International, Inc. (TPX) - Porter's Five Forces: Threat of substitutes
The threat from substitutes for Tempur Sealy International, Inc. is substantial, driven by channel shifts and technological alternatives that bypass traditional premium bedding purchases.
E-commerce mattress sales are a major substitute, projected to reach $32.5 billion by 2025. This channel shift favors Direct-to-Consumer (DTC) models and online retailers, which often compete on price and convenience, directly challenging the established retail footprint of Tempur Sealy International, Inc..
Connected sleep technology, a $21.6 billion market, offers non-traditional sleep solutions. This market segment, which includes smart beds and advanced monitoring, competes for the consumer's discretionary spending on sleep improvement, moving funds away from traditional mattress replacement cycles.
Consumers can substitute down-market to private label or lower-cost OEM products. Tempur Sealy International, Inc. itself has non-branded offerings consisting of value-focused private label and OEM products, indicating the existence and acceptance of this lower-cost tier within the market. Furthermore, Tempur Sealy International, Inc. sells nearly ninety percent of its mattresses on a wholesale basis to independent retailers, creating a channel where lower-cost alternatives are readily available.
Alternative sleep products, like smart bases and pillows, are defintely growing fast, pulling focus and budget from full mattress replacement. The growth trajectory for these specific substitutes is steep:
| Substitute Product Category | Market Value (2024) | Projected Market Value (2032) | CAGR (Forecast Period) |
| Smart Pillow Market | USD 2.19 billion | USD 18.78 billion | 30.80% (2025-2032) |
| Smart Bedding Market (Total) | USD 3.16 billion | USD 5.11 billion | 6.18% (2025-2032) |
| Sleep Tech Devices Market (Broader) | USD 24.9 billion | USD 134.7 billion (2034) | 18.5% (2025-2034) |
The overall sleep technology device market is estimated to be valued at USD 23.32 Bn in 2025, with some estimates placing it higher at USD 29.3 billion in 2025.
Key growth drivers for these substitutes include:
- Rising consumer interest in sleep quality and wellness technologies.
- Increasing adoption of smart home devices.
- Advancements in sensor and AI-based sleep tracking.
- High consumer spending in North America, which held a 40.3% share of the smart pillow market in 2023.
The global mattress market itself is projected to be $57.51 billion in 2025, making the combined value of these substitutes a significant portion of the total addressable market for sleep solutions.
Tempur Sealy International, Inc. (TPX) - Porter's Five Forces: Threat of new entrants
The threat of new entrants for Tempur Sealy International, Inc. is a mixed bag, characterized by high structural barriers that protect the incumbent position, yet simultaneously threatened by the low-overhead nature of the digital-first competitor model.
Capital expenditure requirements act as a significant deterrent. For the fiscal year 2025, Tempur Sealy International, Inc. expects its total Capital Expenditures (CapEx) to be approximately $175 million. This figure is broken down into about $150 million for normal recurring CapEx and an additional $25 million earmarked for bringing recently acquired Mattress Firm stores up to the company's standards. This level of ongoing investment in physical infrastructure creates a substantial hurdle for any potential large-scale competitor seeking to match the existing manufacturing and retail footprint.
Intellectual property forms another formidable barrier to entry. Tempur Sealy International, Inc. maintains a deep portfolio, holding a total of 1,737 patents globally, with 1,166 of those patents already granted. Furthermore, as of late 2025, 1,023 of these patents remain active. This extensive IP moat, covering design and function of many mattress and pillow products, requires significant, sustained R&D spending to replicate.
However, the ease of entry for digitally native competitors remains a key pressure point. The low-overhead, online-only Direct-to-Consumer (DTC) model allows smaller, agile players to bypass the massive capital needs of physical retail. To be fair, established players are now adopting this playbook; for instance, Serta Simmons launched dedicated online-only lines in 2025. The market is characterized by numerous such digitally focused brands that can enter with minimal physical overhead.
The sheer scale of the existing manufacturing and distribution network is a major cost barrier that new entrants must overcome. Tempur Sealy International, Inc. operates 33 North American facilities and 38 international factories. Building out this complex, global footprint to service national demand efficiently requires capital and time that a new entrant might not possess.
Here's a quick look at the scale of operational barriers versus the IP barrier:
| Barrier Component | Metric/Amount | Context |
| Expected 2025 CapEx | $175 million | Total expected capital expenditure for the year. |
| Total Global Patents | 1,737 | Total patents held globally, demonstrating IP depth. |
| Active Global Patents | 1,023 | Number of patents currently in force. |
| North American Facilities | 33 | Number of manufacturing and distribution sites in North America. |
The nature of the threat from new entrants can be summarized by the following factors:
- High upfront capital required for scale.
- Significant investment in R&D to challenge IP.
- DTC model allows for low-overhead market entry.
- Established competitors are adopting the online-only strategy.
Finance: review the 2026 CapEx plan against the 2025 actuals by end of Q1.
Disclaimer
All information, articles, and product details provided on this website are for general informational and educational purposes only. We do not claim any ownership over, nor do we intend to infringe upon, any trademarks, copyrights, logos, brand names, or other intellectual property mentioned or depicted on this site. Such intellectual property remains the property of its respective owners, and any references here are made solely for identification or informational purposes, without implying any affiliation, endorsement, or partnership.
We make no representations or warranties, express or implied, regarding the accuracy, completeness, or suitability of any content or products presented. Nothing on this website should be construed as legal, tax, investment, financial, medical, or other professional advice. In addition, no part of this site—including articles or product references—constitutes a solicitation, recommendation, endorsement, advertisement, or offer to buy or sell any securities, franchises, or other financial instruments, particularly in jurisdictions where such activity would be unlawful.
All content is of a general nature and may not address the specific circumstances of any individual or entity. It is not a substitute for professional advice or services. Any actions you take based on the information provided here are strictly at your own risk. You accept full responsibility for any decisions or outcomes arising from your use of this website and agree to release us from any liability in connection with your use of, or reliance upon, the content or products found herein.