
|
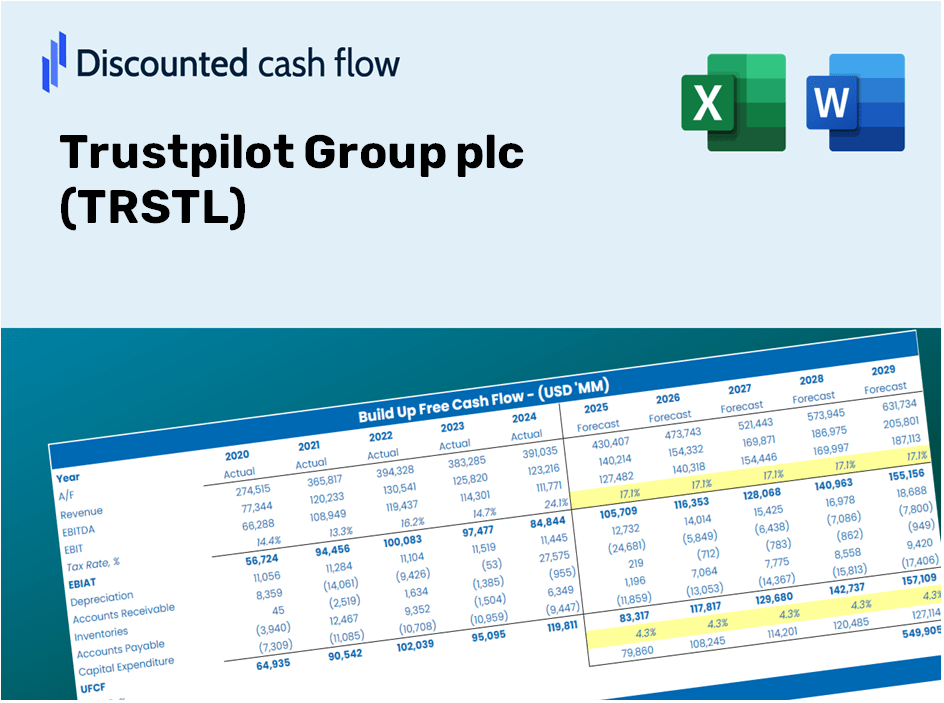
Valoración de DCF de confianza de Group PLC (TRST.L) |
Completamente Editable: Adáptelo A Sus Necesidades En Excel O Sheets
Diseño Profesional: Plantillas Confiables Y Estándares De La Industria
Predeterminadas Para Un Uso Rápido Y Eficiente
Compatible con MAC / PC, completamente desbloqueado
No Se Necesita Experiencia; Fáciles De Seguir
Trustpilot Group plc (TRST.L) Bundle
¡Descubra todo el potencial del valor de Trustpilot Group PLC (TRSTL) con nuestra calculadora DCF avanzada! Ajuste los supuestos clave, explore varios escenarios y evalúe cómo los cambios afectan la valoración del PLC del grupo de confianza de Trustpilot (TRSTL), todo dentro de una plantilla de Excel conveniente.
Discounted Cash Flow (DCF) - (USD MM)
| Year | AY1 2020 |
AY2 2021 |
AY3 2022 |
AY4 2023 |
AY5 2024 |
FY1 2025 |
FY2 2026 |
FY3 2027 |
FY4 2028 |
FY5 2029 |
|---|---|---|---|---|---|---|---|---|---|---|
| Revenue | 75.8 | 97.7 | 110.7 | 131.1 | 156.6 | 188.0 | 225.7 | 270.9 | 325.1 | 390.2 |
| Revenue Growth, % | 0 | 28.88 | 13.31 | 18.42 | 19.5 | 20.03 | 20.03 | 20.03 | 20.03 | 20.03 |
| EBITDA | -4.0 | -12.0 | -5.0 | 6.6 | 13.2 | -3.2 | -3.9 | -4.7 | -5.6 | -6.7 |
| EBITDA, % | -5.31 | -12.29 | -4.48 | 5.06 | 8.4 | -1.73 | -1.73 | -1.73 | -1.73 | -1.73 |
| Depreciation | 4.3 | 6.0 | 5.5 | 6.7 | 8.1 | 10.2 | 12.2 | 14.6 | 17.6 | 21.1 |
| Depreciation, % | 5.63 | 6.17 | 4.94 | 5.09 | 5.17 | 5.4 | 5.4 | 5.4 | 5.4 | 5.4 |
| EBIT | -8.3 | -18.0 | -10.4 | .0 | 5.1 | -13.4 | -16.1 | -19.3 | -23.2 | -27.8 |
| EBIT, % | -10.94 | -18.46 | -9.42 | -0.0328869 | 3.23 | -7.13 | -7.13 | -7.13 | -7.13 | -7.13 |
| Total Cash | 37.5 | 69.3 | 54.6 | 68.0 | 51.2 | 95.6 | 114.7 | 137.7 | 165.3 | 198.4 |
| Total Cash, percent | .0 | .0 | .0 | .0 | .0 | .0 | .0 | .0 | .0 | .0 |
| Account Receivables | 3.9 | 4.6 | 6.2 | 7.3 | 9.5 | 10.2 | 12.2 | 14.6 | 17.6 | 21.1 |
| Account Receivables, % | 5.13 | 4.7 | 5.56 | 5.57 | 6.07 | 5.4 | 5.4 | 5.4 | 5.4 | 5.4 |
| Inventories | .0 | .0 | .0 | .0 | .0 | .0 | .0 | .0 | .0 | .0 |
| Inventories, % | 0 | 0 | 0 | 0 | 0 | 0 | 0 | 0 | 0 | 0 |
| Accounts Payable | .9 | 1.4 | 2.1 | 3.3 | 2.7 | 3.3 | 4.0 | 4.7 | 5.7 | 6.8 |
| Accounts Payable, % | 1.25 | 1.4 | 1.86 | 2.54 | 1.72 | 1.75 | 1.75 | 1.75 | 1.75 | 1.75 |
| Capital Expenditure | -3.8 | -3.1 | -5.5 | -2.6 | -7.2 | -7.4 | -8.9 | -10.7 | -12.8 | -15.4 |
| Capital Expenditure, % | -4.96 | -3.21 | -4.97 | -2.02 | -4.57 | -3.94 | -3.94 | -3.94 | -3.94 | -3.94 |
| Tax Rate, % | -20.3 | -20.3 | -20.3 | -20.3 | -20.3 | -20.3 | -20.3 | -20.3 | -20.3 | -20.3 |
| EBITAT | -7.9 | -17.6 | -10.2 | .2 | 6.1 | -10.4 | -12.5 | -15.0 | -18.0 | -21.7 |
| Depreciation | ||||||||||
| Changes in Account Receivables | ||||||||||
| Changes in Inventories | ||||||||||
| Changes in Accounts Payable | ||||||||||
| Capital Expenditure | ||||||||||
| UFCF | -10.3 | -15.0 | -11.1 | 4.3 | 4.2 | -7.7 | -10.6 | -12.7 | -15.3 | -18.4 |
| WACC, % | 7.64 | 7.65 | 7.65 | 7.52 | 7.65 | 7.62 | 7.62 | 7.62 | 7.62 | 7.62 |
| PV UFCF | ||||||||||
| SUM PV UFCF | -50.7 | |||||||||
| Long Term Growth Rate, % | 2.00 | |||||||||
| Free cash flow (T + 1) | -19 | |||||||||
| Terminal Value | -333 | |||||||||
| Present Terminal Value | -231 | |||||||||
| Enterprise Value | -281 | |||||||||
| Net Debt | -36 | |||||||||
| Equity Value | -245 | |||||||||
| Diluted Shares Outstanding, MM | 442 | |||||||||
| Equity Value Per Share | -55.44 |
What You Will Receive
- Authentic Trustpilot Financial Data: Pre-loaded with Trustpilot’s historical and projected figures for accurate analysis.
- Completely Customizable Template: Effortlessly adjust key inputs such as revenue growth, WACC, and EBITDA percentage.
- Instant Calculations: Watch Trustpilot’s intrinsic value reflect your updates in real-time.
- Expert Valuation Tool: Crafted for investors, analysts, and consultants in pursuit of precise DCF outcomes.
- User-Friendly Layout: Intuitive design and straightforward guidance suitable for all skill levels.
Key Features
- Pre-Loaded Data: Trustpilot Group plc’s historical financial statements and pre-filled projections.
- Fully Adjustable Inputs: Modify WACC, tax rates, revenue growth, and EBITDA margins as needed.
- Instant Results: View Trustpilot’s intrinsic value recalculating in real time.
- Clear Visual Outputs: Dashboard charts illustrate valuation results and essential metrics.
- Built for Accuracy: A professional tool designed for analysts, investors, and finance professionals.
How It Functions
- Download the Template: Gain immediate access to the Excel-based Trustpilot Group plc (TRSTL) DCF Calculator.
- Input Your Assumptions: Modify the yellow-highlighted cells for growth rates, WACC, margins, and more.
- Instant Calculations: The model automatically recalculates Trustpilot's intrinsic value.
- Test Scenarios: Experiment with different assumptions to assess potential changes in valuation.
- Analyze and Decide: Leverage the results to inform your investment or financial evaluation.
Why Choose This Calculator for Trustpilot Group plc (TRSTL)?
- Precision: Utilizes authentic Trustpilot financials to ensure data reliability.
- Versatility: Tailored for users to easily adjust and experiment with inputs.
- Efficiency: Eliminate the complexity of constructing a DCF model from the ground up.
- Expert-Level: Crafted with the accuracy and functionality expected at the CFO level.
- Intuitive: Simple to navigate, making it accessible for users with limited financial modeling skills.
Who Can Benefit from This Product?
- Finance Students: Master valuation methods and apply them with real-world data.
- Academics: Enhance coursework or research by integrating professional valuation models.
- Investors: Validate your assumptions and evaluate valuation results for Trustpilot Group plc (TRSTL) stock.
- Analysts: Optimize your process with a customizable, ready-to-use DCF model.
- Small Business Owners: Understand the analytical approaches used for large public companies like Trustpilot Group plc (TRSTL).
Contents of the Template
- Comprehensive DCF Model: An editable template featuring in-depth valuation calculations.
- Real-World Data: Trustpilot Group plc’s (TRSTL) historical and projected financial information preloaded for analysis.
- Customizable Parameters: Modify WACC, growth rates, and tax assumptions to explore different scenarios.
- Financial Statements: Complete annual and quarterly breakdowns for enhanced insights.
- Key Ratios: Integrated analysis for profitability, efficiency, and leverage metrics.
- Dashboard with Visual Outputs: Charts and tables providing clear, actionable results.
Disclaimer
All information, articles, and product details provided on this website are for general informational and educational purposes only. We do not claim any ownership over, nor do we intend to infringe upon, any trademarks, copyrights, logos, brand names, or other intellectual property mentioned or depicted on this site. Such intellectual property remains the property of its respective owners, and any references here are made solely for identification or informational purposes, without implying any affiliation, endorsement, or partnership.
We make no representations or warranties, express or implied, regarding the accuracy, completeness, or suitability of any content or products presented. Nothing on this website should be construed as legal, tax, investment, financial, medical, or other professional advice. In addition, no part of this site—including articles or product references—constitutes a solicitation, recommendation, endorsement, advertisement, or offer to buy or sell any securities, franchises, or other financial instruments, particularly in jurisdictions where such activity would be unlawful.
All content is of a general nature and may not address the specific circumstances of any individual or entity. It is not a substitute for professional advice or services. Any actions you take based on the information provided here are strictly at your own risk. You accept full responsibility for any decisions or outcomes arising from your use of this website and agree to release us from any liability in connection with your use of, or reliance upon, the content or products found herein.