
|
Valoración DCF de Trevena, Inc. (TRVN) |
Completamente Editable: Adáptelo A Sus Necesidades En Excel O Sheets
Diseño Profesional: Plantillas Confiables Y Estándares De La Industria
Predeterminadas Para Un Uso Rápido Y Eficiente
Compatible con MAC / PC, completamente desbloqueado
No Se Necesita Experiencia; Fáciles De Seguir
Trevena, Inc. (TRVN) Bundle
¡Ahorre tiempo y mejore la precisión con nuestra calculadora DCF (TRVN)! Equipado con datos reales de Treva, Inc. y suposiciones personalizables, esta herramienta le permite pronosticar, analizar y valorar treva como un inversor experimentado.
What You Will Get
- Editable Excel Template: A fully customizable Excel-based DCF Calculator featuring pre-filled real TRVN financials.
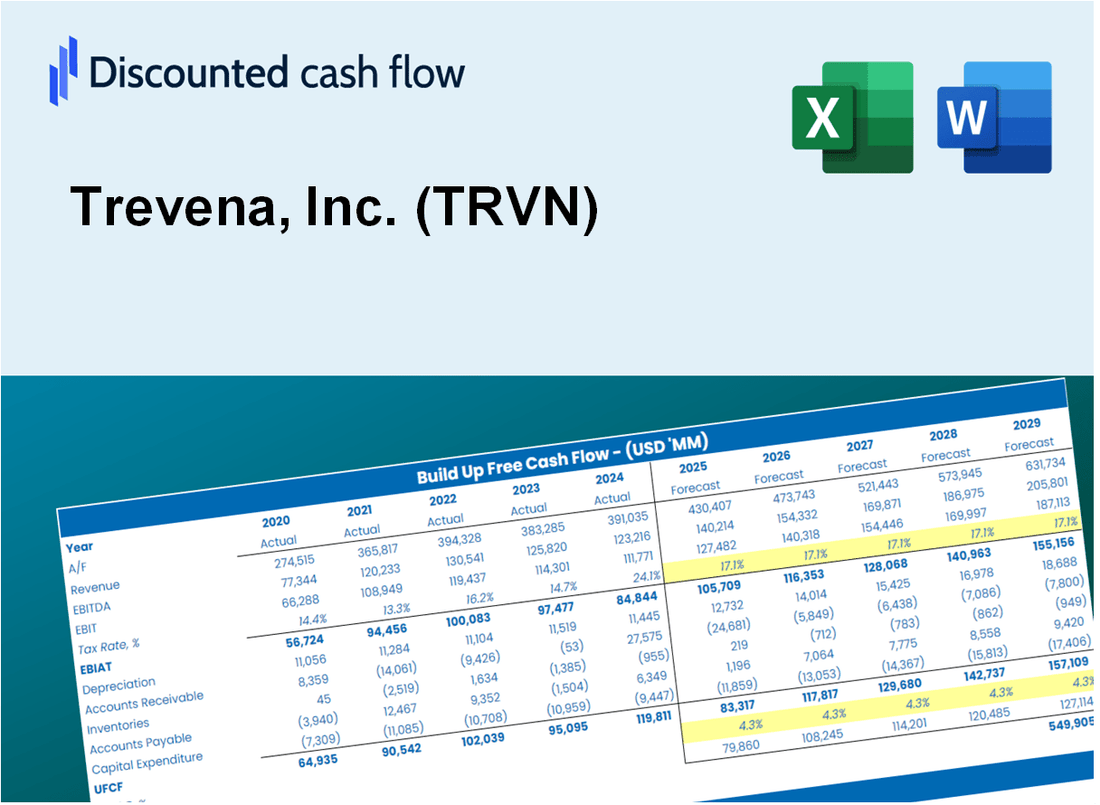
- Real-World Data: Historical data and forward-looking estimates (highlighted in the yellow cells).
- Forecast Flexibility: Adjust forecast assumptions such as revenue growth, EBITDA %, and WACC.
- Automatic Calculations: Quickly observe how your inputs affect Trevena, Inc.'s valuation.
- Professional Tool: Designed for investors, CFOs, consultants, and financial analysts.
- User-Friendly Design: Organized for clarity and ease of use, complete with step-by-step instructions.
Key Features
- Advanced DCF Calculator: Features comprehensive unlevered and levered DCF valuation models tailored for Trevena, Inc. (TRVN).
- WACC Calculator: Comes with a pre-built Weighted Average Cost of Capital sheet that allows for customizable inputs specific to Trevena.
- Editable Forecast Assumptions: Adjust growth rates, capital expenditures, and discount rates to fit Trevena's financial outlook.
- Built-In Financial Ratios: Evaluate profitability, leverage, and efficiency ratios relevant to Trevena, Inc. (TRVN).
- Dashboard and Charts: Visual representations summarize essential valuation metrics for straightforward analysis of Trevena.
How It Works
- Step 1: Download the prebuilt Excel template featuring Trevena, Inc. (TRVN) data.
- Step 2: Navigate through the pre-filled sheets to grasp the essential metrics.
- Step 3: Modify forecasts and assumptions in the editable yellow cells (WACC, growth, margins).
- Step 4: Instantly see the recalculated results, including Trevena, Inc.'s (TRVN) intrinsic value.
- Step 5: Make well-informed investment decisions or create reports based on the outputs.
Why Choose This Calculator?
- Accurate Data: Real Trevena, Inc. (TRVN) financials ensure reliable valuation results.
- Customizable: Adjust key parameters like growth rates, WACC, and tax rates to match your projections.
- Time-Saving: Pre-built calculations eliminate the need to start from scratch.
- Professional-Grade Tool: Designed for investors, analysts, and consultants.
- User-Friendly: Intuitive layout and step-by-step instructions make it easy for all users.
Who Should Use Trevena, Inc. (TRVN)?
- Investors: Assess investment opportunities with confidence using our comprehensive data and insights.
- Pharmaceutical Analysts: Streamline research with access to detailed reports and market analysis.
- Healthcare Consultants: Tailor our resources for effective client presentations or strategic recommendations.
- Biotech Enthusiasts: Enhance your knowledge of drug development and market trends through real-world case studies.
- Educators and Students: Utilize our materials as a hands-on learning resource in pharmaceutical and biotech courses.
What the Template Contains
- Comprehensive DCF Model: Editable template featuring detailed valuation calculations tailored for Trevena, Inc. (TRVN).
- Real-World Data: Trevena’s historical and projected financials preloaded for thorough analysis.
- Customizable Parameters: Modify WACC, growth rates, and tax assumptions to explore various scenarios.
- Financial Statements: Complete annual and quarterly breakdowns for enhanced insights.
- Key Ratios: Integrated analysis for profitability, efficiency, and leverage metrics.
- Dashboard with Visual Outputs: Visualizations including charts and tables for clear, actionable results.
Disclaimer
All information, articles, and product details provided on this website are for general informational and educational purposes only. We do not claim any ownership over, nor do we intend to infringe upon, any trademarks, copyrights, logos, brand names, or other intellectual property mentioned or depicted on this site. Such intellectual property remains the property of its respective owners, and any references here are made solely for identification or informational purposes, without implying any affiliation, endorsement, or partnership.
We make no representations or warranties, express or implied, regarding the accuracy, completeness, or suitability of any content or products presented. Nothing on this website should be construed as legal, tax, investment, financial, medical, or other professional advice. In addition, no part of this site—including articles or product references—constitutes a solicitation, recommendation, endorsement, advertisement, or offer to buy or sell any securities, franchises, or other financial instruments, particularly in jurisdictions where such activity would be unlawful.
All content is of a general nature and may not address the specific circumstances of any individual or entity. It is not a substitute for professional advice or services. Any actions you take based on the information provided here are strictly at your own risk. You accept full responsibility for any decisions or outcomes arising from your use of this website and agree to release us from any liability in connection with your use of, or reliance upon, the content or products found herein.