
|
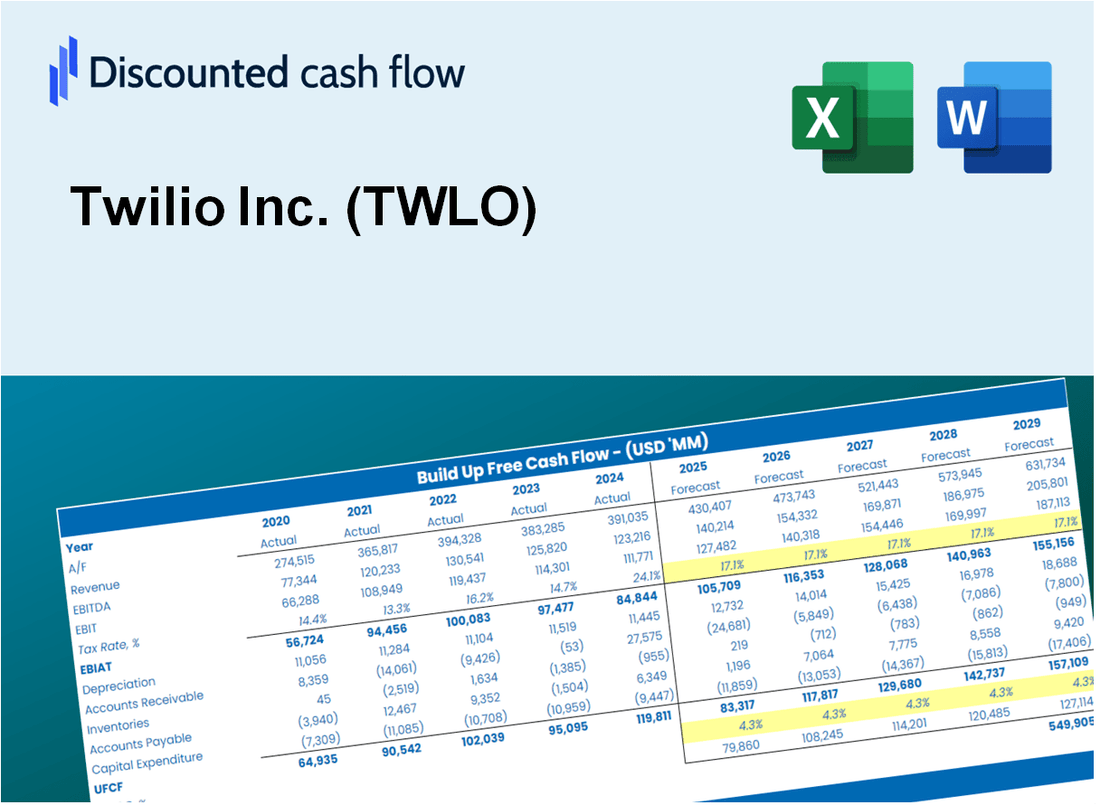
Valoración DCF de Twilio Inc. (TWLO) |
Completamente Editable: Adáptelo A Sus Necesidades En Excel O Sheets
Diseño Profesional: Plantillas Confiables Y Estándares De La Industria
Predeterminadas Para Un Uso Rápido Y Eficiente
Compatible con MAC / PC, completamente desbloqueado
No Se Necesita Experiencia; Fáciles De Seguir
Twilio Inc. (TWLO) Bundle
¡Evalúe las perspectivas financieras de Twilio Inc. (TWLO) con precisión experta! Esta calculadora DCF (TWLO) viene con datos financieros prejuidos y ofrece la flexibilidad para modificar el crecimiento de los ingresos, WACC, los márgenes y otros supuestos esenciales para alinearse con sus proyecciones.
Discounted Cash Flow (DCF) - (USD MM)
| Year | AY1 2020 |
AY2 2021 |
AY3 2022 |
AY4 2023 |
AY5 2024 |
FY1 2025 |
FY2 2026 |
FY3 2027 |
FY4 2028 |
FY5 2029 |
|---|---|---|---|---|---|---|---|---|---|---|
| Revenue | 1,761.8 | 2,841.8 | 3,826.3 | 4,153.9 | 4,458.0 | 5,704.4 | 7,299.2 | 9,339.9 | 11,951.1 | 15,292.4 |
| Revenue Growth, % | 0 | 61.31 | 34.64 | 8.56 | 7.32 | 27.96 | 27.96 | 27.96 | 27.96 | 27.96 |
| EBITDA | -291.4 | -653.8 | -917.3 | -685.3 | 136.5 | -878.0 | -1,123.4 | -1,437.5 | -1,839.4 | -2,353.7 |
| EBITDA, % | -16.54 | -23 | -23.97 | -16.5 | 3.06 | -15.39 | -15.39 | -15.39 | -15.39 | -15.39 |
| Depreciation | 188.1 | 307.2 | 326.3 | 311.4 | 225.1 | 485.5 | 621.2 | 794.9 | 1,017.2 | 1,301.5 |
| Depreciation, % | 10.67 | 10.81 | 8.53 | 7.5 | 5.05 | 8.51 | 8.51 | 8.51 | 8.51 | 8.51 |
| EBIT | -479.4 | -960.9 | -1,243.6 | -996.7 | -88.6 | -1,363.5 | -1,744.7 | -2,232.5 | -2,856.6 | -3,655.2 |
| EBIT, % | -27.21 | -33.81 | -32.5 | -23.99 | -1.99 | -23.9 | -23.9 | -23.9 | -23.9 | -23.9 |
| Total Cash | 3,039.8 | 5,357.9 | 4,155.1 | 4,012.0 | 2,384.4 | 5,134.7 | 6,570.3 | 8,407.2 | 10,757.6 | 13,765.2 |
| Total Cash, percent | .0 | .0 | .0 | .0 | .0 | .0 | .0 | .0 | .0 | .0 |
| Account Receivables | 251.2 | 388.2 | 547.5 | 562.8 | 588.5 | 786.9 | 1,006.9 | 1,288.5 | 1,648.7 | 2,109.6 |
| Account Receivables, % | 14.26 | 13.66 | 14.31 | 13.55 | 13.2 | 13.8 | 13.8 | 13.8 | 13.8 | 13.8 |
| Inventories | .0 | .0 | .0 | .0 | .0 | .0 | .0 | .0 | .0 | .0 |
| Inventories, % | 0 | 0 | 0 | 0 | 0 | 0 | 0 | 0 | 0 | 0 |
| Accounts Payable | 60.0 | 93.3 | 124.6 | 119.6 | 100.2 | 172.0 | 220.1 | 281.6 | 360.3 | 461.1 |
| Accounts Payable, % | 3.41 | 3.28 | 3.26 | 2.88 | 2.25 | 3.02 | 3.02 | 3.02 | 3.02 | 3.02 |
| Capital Expenditure | -59.1 | -90.0 | -80.2 | -51.2 | -58.8 | -127.5 | -163.1 | -208.7 | -267.0 | -341.7 |
| Capital Expenditure, % | -3.36 | -3.17 | -2.1 | -1.23 | -1.32 | -2.23 | -2.23 | -2.23 | -2.23 | -2.23 |
| Tax Rate, % | -23.46 | -23.46 | -23.46 | -23.46 | -23.46 | -23.46 | -23.46 | -23.46 | -23.46 | -23.46 |
| EBITAT | -466.7 | -949.9 | -1,256.1 | -1,015.4 | -109.4 | -1,353.1 | -1,731.4 | -2,215.4 | -2,834.8 | -3,627.4 |
| Depreciation | ||||||||||
| Changes in Account Receivables | ||||||||||
| Changes in Inventories | ||||||||||
| Changes in Accounts Payable | ||||||||||
| Capital Expenditure | ||||||||||
| UFCF | -528.9 | -836.5 | -1,138.1 | -775.5 | 11.7 | -1,121.6 | -1,445.2 | -1,849.2 | -2,366.2 | -3,027.7 |
| WACC, % | 9.65 | 9.66 | 9.66 | 9.66 | 9.66 | 9.66 | 9.66 | 9.66 | 9.66 | 9.66 |
| PV UFCF | ||||||||||
| SUM PV UFCF | -7,172.9 | |||||||||
| Long Term Growth Rate, % | 2.00 | |||||||||
| Free cash flow (T + 1) | -3,088 | |||||||||
| Terminal Value | -40,328 | |||||||||
| Present Terminal Value | -25,434 | |||||||||
| Enterprise Value | -32,607 | |||||||||
| Net Debt | 689 | |||||||||
| Equity Value | -33,296 | |||||||||
| Diluted Shares Outstanding, MM | 166 | |||||||||
| Equity Value Per Share | -200.67 |
What You Will Get
- Real TWLO Financials: Access comprehensive historical and projected data for precise valuation.
- Customizable Parameters: Adjust WACC, tax rates, revenue growth, and capital expenditures to fit your analysis.
- Dynamic Calculations: Intrinsic value and NPV are calculated in real-time for accuracy.
- Scenario Analysis: Evaluate various scenarios to assess Twilio's future performance.
- User-Friendly Interface: Designed for professionals while remaining accessible to newcomers.
Key Features
- Pre-Loaded Data: Twilio Inc.'s historical financial statements and pre-filled forecasts.
- Fully Adjustable Inputs: Modify WACC, tax rates, revenue growth, and EBITDA margins as needed.
- Instant Results: Observe Twilio Inc.'s intrinsic value recalculating in real time.
- Clear Visual Outputs: Dashboard charts showcase valuation results and essential metrics.
- Built for Accuracy: A professional tool designed for analysts, investors, and finance professionals.
How It Works
- Step 1: Download the Excel file.
- Step 2: Review Twilio Inc.'s (TWLO) pre-filled financial data and forecasts.
- Step 3: Modify critical inputs like revenue growth, WACC, and tax rates (highlighted cells).
- Step 4: Watch the DCF model update instantly as you tweak assumptions.
- Step 5: Analyze the outputs and use the results for investment decisions.
Why Choose Twilio Inc. (TWLO)?
- Streamline Communication: Effortlessly integrate messaging, voice, and video capabilities into your applications.
- Enhance Customer Engagement: Utilize powerful APIs to create personalized experiences for your users.
- Scalable Solutions: Easily scale your communication needs as your business grows.
- Robust Security: Benefit from industry-leading security measures to protect your data.
- Backed by a Strong Community: Join a thriving ecosystem of developers and businesses leveraging Twilio's technology.
Who Should Use This Product?
- Developers: Enhance your understanding of communication APIs and integrate them into your applications.
- Entrepreneurs: Utilize Twilio's tools to build scalable communication solutions for your startups.
- Marketers: Analyze customer engagement metrics and optimize outreach strategies using Twilio's platform.
- Data Analysts: Leverage Twilio's analytics features to gain insights into user interactions and improve performance.
- Businesses of All Sizes: Discover how to leverage Twilio's services to enhance customer communication and support.
What the Template Contains
- Historical Data: Includes Twilio Inc.’s past financials and baseline forecasts.
- DCF and Levered DCF Models: Detailed templates to calculate Twilio Inc.’s intrinsic value.
- WACC Sheet: Pre-built calculations for Weighted Average Cost of Capital.
- Editable Inputs: Modify key drivers like growth rates, EBITDA %, and CAPEX assumptions.
- Quarterly and Annual Statements: A complete breakdown of Twilio Inc.’s financials.
- Interactive Dashboard: Visualize valuation results and projections dynamically.
Disclaimer
All information, articles, and product details provided on this website are for general informational and educational purposes only. We do not claim any ownership over, nor do we intend to infringe upon, any trademarks, copyrights, logos, brand names, or other intellectual property mentioned or depicted on this site. Such intellectual property remains the property of its respective owners, and any references here are made solely for identification or informational purposes, without implying any affiliation, endorsement, or partnership.
We make no representations or warranties, express or implied, regarding the accuracy, completeness, or suitability of any content or products presented. Nothing on this website should be construed as legal, tax, investment, financial, medical, or other professional advice. In addition, no part of this site—including articles or product references—constitutes a solicitation, recommendation, endorsement, advertisement, or offer to buy or sell any securities, franchises, or other financial instruments, particularly in jurisdictions where such activity would be unlawful.
All content is of a general nature and may not address the specific circumstances of any individual or entity. It is not a substitute for professional advice or services. Any actions you take based on the information provided here are strictly at your own risk. You accept full responsibility for any decisions or outcomes arising from your use of this website and agree to release us from any liability in connection with your use of, or reliance upon, the content or products found herein.