
|
Valoración de DCF de Tri-Continental Corporation PFD $ 2.50 (TY-P) |
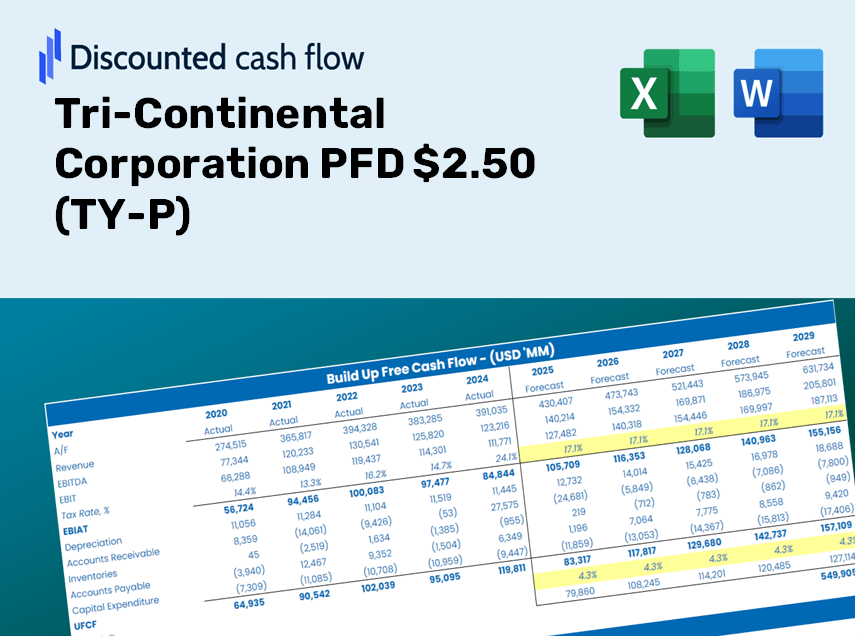
Completamente Editable: Adáptelo A Sus Necesidades En Excel O Sheets
Diseño Profesional: Plantillas Confiables Y Estándares De La Industria
Predeterminadas Para Un Uso Rápido Y Eficiente
Compatible con MAC / PC, completamente desbloqueado
No Se Necesita Experiencia; Fáciles De Seguir
Tri-Continental Corporation PFD $2.50 (TY-P) Bundle
¡Explore el futuro financiero de Tri-Continental Corporation PFD $ 2.50 (TY-P) con nuestra calculadora DCF fácil de usar! Ingrese sus suposiciones para el crecimiento, los márgenes y los costos para calcular el valor intrínseco de Tri-Continental Corporation PFD $ 2.50 (TY-P) y mejorar su estrategia de inversión.
Discounted Cash Flow (DCF) - (USD MM)
| Year | AY1 2020 |
AY2 2021 |
AY3 2022 |
AY4 2023 |
AY5 2024 |
FY1 2025 |
FY2 2026 |
FY3 2027 |
FY4 2028 |
FY5 2029 |
|---|---|---|---|---|---|---|---|---|---|---|
| Revenue | 199.0 | 436.7 | -291.4 | 253.9 | 321.7 | 262.7 | 214.6 | 175.2 | 143.1 | 116.9 |
| Revenue Growth, % | 0 | 119.44 | -166.73 | -187.14 | 26.68 | -18.33 | -18.33 | -18.33 | -18.33 | -18.33 |
| EBITDA | 198.0 | 435.7 | -292.2 | 253.1 | 320.7 | 262.0 | 214.0 | 174.8 | 142.7 | 116.6 |
| EBITDA, % | 99.48 | 99.78 | 100.28 | 99.67 | 99.72 | 99.73 | 99.73 | 99.73 | 99.73 | 99.73 |
| Depreciation | .0 | .0 | .0 | .0 | .0 | .0 | .0 | .0 | .0 | .0 |
| Depreciation, % | 0 | 0 | 0 | 0 | 0 | 0 | 0 | 0 | 0 | 0 |
| EBIT | 198.0 | 435.7 | -292.2 | 253.1 | 320.7 | 262.0 | 214.0 | 174.8 | 142.7 | 116.6 |
| EBIT, % | 99.48 | 99.78 | 100.28 | 99.67 | 99.72 | 99.73 | 99.73 | 99.73 | 99.73 | 99.73 |
| Total Cash | .1 | .0 | .0 | .0 | .0 | .0 | .0 | .0 | .0 | .0 |
| Total Cash, percent | .0 | .0 | .0 | .0 | .0 | .0 | .0 | .0 | .0 | .0 |
| Account Receivables | 9.8 | 8.3 | 9.7 | 17.8 | 10.7 | 7.3 | 5.9 | 4.9 | 4.0 | 3.2 |
| Account Receivables, % | 4.93 | 1.91 | -3.34 | 7.03 | 3.34 | 2.77 | 2.77 | 2.77 | 2.77 | 2.77 |
| Inventories | .0 | .0 | .0 | .0 | .0 | .0 | .0 | .0 | .0 | .0 |
| Inventories, % | 0 | 0 | 0 | 0 | 0 | 0 | 0 | 0 | 0 | 0 |
| Accounts Payable | 1.7 | 1.6 | 1.2 | 4.0 | 2.8 | 1.7 | 1.4 | 1.1 | .9 | .8 |
| Accounts Payable, % | 0.84515 | 0.3778 | -0.40626 | 1.58 | 0.85619 | 0.64994 | 0.64994 | 0.64994 | 0.64994 | 0.64994 |
| Capital Expenditure | .0 | .0 | .0 | .0 | .0 | .0 | .0 | .0 | .0 | .0 |
| Capital Expenditure, % | 0 | 0 | 0 | 0 | 0 | 0 | 0 | 0 | 0 | 0 |
| Tax Rate, % | 0 | 0 | 0 | 0 | 0 | 0 | 0 | 0 | 0 | 0 |
| EBITAT | 198.0 | 435.7 | -292.2 | 253.1 | 320.7 | 262.0 | 214.0 | 174.8 | 142.7 | 116.6 |
| Depreciation | ||||||||||
| Changes in Account Receivables | ||||||||||
| Changes in Inventories | ||||||||||
| Changes in Accounts Payable | ||||||||||
| Capital Expenditure | ||||||||||
| UFCF | 189.8 | 437.2 | -294.1 | 247.8 | 326.6 | 264.4 | 215.0 | 175.6 | 143.4 | 117.1 |
| WACC, % | 7.78 | 7.78 | 7.78 | 7.78 | 7.78 | 7.78 | 7.78 | 7.78 | 7.78 | 7.78 |
| PV UFCF | ||||||||||
| SUM PV UFCF | 757.5 | |||||||||
| Long Term Growth Rate, % | 0.50 | |||||||||
| Free cash flow (T + 1) | 118 | |||||||||
| Terminal Value | 1,618 | |||||||||
| Present Terminal Value | 1,113 | |||||||||
| Enterprise Value | 1,870 | |||||||||
| Net Debt | 0 | |||||||||
| Equity Value | 1,870 | |||||||||
| Diluted Shares Outstanding, MM | 52 | |||||||||
| Equity Value Per Share | 36.21 |
Your Benefits
- Adjustable Input Parameters: Effortlessly modify key assumptions (growth %, profit margins, WACC) to explore various scenarios.
- Real-World Data: Tri-Continental Corporation's financial data pre-loaded to kickstart your evaluation.
- Automated DCF Calculations: The template computes Net Present Value (NPV) and intrinsic value automatically.
- Professional and Customizable: A refined Excel model designed to meet your valuation requirements.
- Built for Analysts and Investors: Perfect for testing forecasts, validating strategies, and enhancing efficiency.
Highlighted Features
- Customizable Forecast Settings: Adjust key inputs such as revenue growth rates, EBITDA percentages, and capital expenditure plans.
- Instant DCF Valuation: Quickly computes intrinsic value, NPV, and provides other essential financial outputs.
- High-Precision Accuracy: Leverages Tri-Continental Corporation's real financial data for trustworthy valuation results.
- Simplified Scenario Analysis: Effortlessly explore various assumptions and assess their impacts side by side.
- Efficiency-Boosting Solution: Avoid the hassle of constructing complicated valuation models from the ground up.
How It Works
- Download: Get the pre-configured Excel file containing Tri-Continental Corporation PFD $2.50 (TY-P) financial data.
- Customize: Modify forecasts, such as revenue growth rate, EBITDA percentage, and WACC values.
- Update Automatically: Intrinsic value and NPV calculations refresh in real-time based on your inputs.
- Test Scenarios: Generate various projections and instantly compare the results.
- Make Decisions: Leverage the valuation findings to inform your investment approach.
Why Opt for Tri-Continental Corporation PFD $2.50 (TY-P)?
- Time-Saving: Skip the hassle of building a model from the ground up – it’s ready for immediate use.
- Enhanced Accuracy: Dependable financial data and formulas minimize valuation errors.
- Completely Customizable: Adjust the model to align with your own assumptions and forecasts.
- User-Friendly: Intuitive charts and outputs simplify result analysis.
- Endorsed by Professionals: Crafted for experts who prioritize accuracy and ease of use.
Who Can Benefit from Tri-Continental Corporation PFD $2.50 (TY-P)?
- Investors: Evaluate Tri-Continental's performance before making stock transactions.
- CFOs and Financial Analysts: Optimize valuation methods and assess financial forecasts.
- Startup Founders: Discover how leading public firms like Tri-Continental are appraised.
- Consultants: Provide clients with comprehensive valuation reports based on Tri-Continental data.
- Students and Educators: Utilize current data to practice and teach valuation principles.
Contents of the Template
- Comprehensive DCF Model: An editable template featuring thorough valuation calculations.
- Real-World Data: Tri-Continental Corporation’s historical and projected financials preloaded for in-depth analysis.
- Customizable Parameters: Modify WACC, growth rates, and tax assumptions to explore various scenarios.
- Financial Statements: Complete annual and quarterly breakdowns for enhanced insights.
- Key Ratios: Built-in analysis covering profitability, efficiency, and leverage metrics.
- Dashboard with Visual Outputs: Engaging charts and tables providing clear, actionable results.
Disclaimer
All information, articles, and product details provided on this website are for general informational and educational purposes only. We do not claim any ownership over, nor do we intend to infringe upon, any trademarks, copyrights, logos, brand names, or other intellectual property mentioned or depicted on this site. Such intellectual property remains the property of its respective owners, and any references here are made solely for identification or informational purposes, without implying any affiliation, endorsement, or partnership.
We make no representations or warranties, express or implied, regarding the accuracy, completeness, or suitability of any content or products presented. Nothing on this website should be construed as legal, tax, investment, financial, medical, or other professional advice. In addition, no part of this site—including articles or product references—constitutes a solicitation, recommendation, endorsement, advertisement, or offer to buy or sell any securities, franchises, or other financial instruments, particularly in jurisdictions where such activity would be unlawful.
All content is of a general nature and may not address the specific circumstances of any individual or entity. It is not a substitute for professional advice or services. Any actions you take based on the information provided here are strictly at your own risk. You accept full responsibility for any decisions or outcomes arising from your use of this website and agree to release us from any liability in connection with your use of, or reliance upon, the content or products found herein.