
|
Valoración DCF de Travelzoo (TZOO) |
Completamente Editable: Adáptelo A Sus Necesidades En Excel O Sheets
Diseño Profesional: Plantillas Confiables Y Estándares De La Industria
Predeterminadas Para Un Uso Rápido Y Eficiente
Compatible con MAC / PC, completamente desbloqueado
No Se Necesita Experiencia; Fáciles De Seguir
Travelzoo (TZOO) Bundle
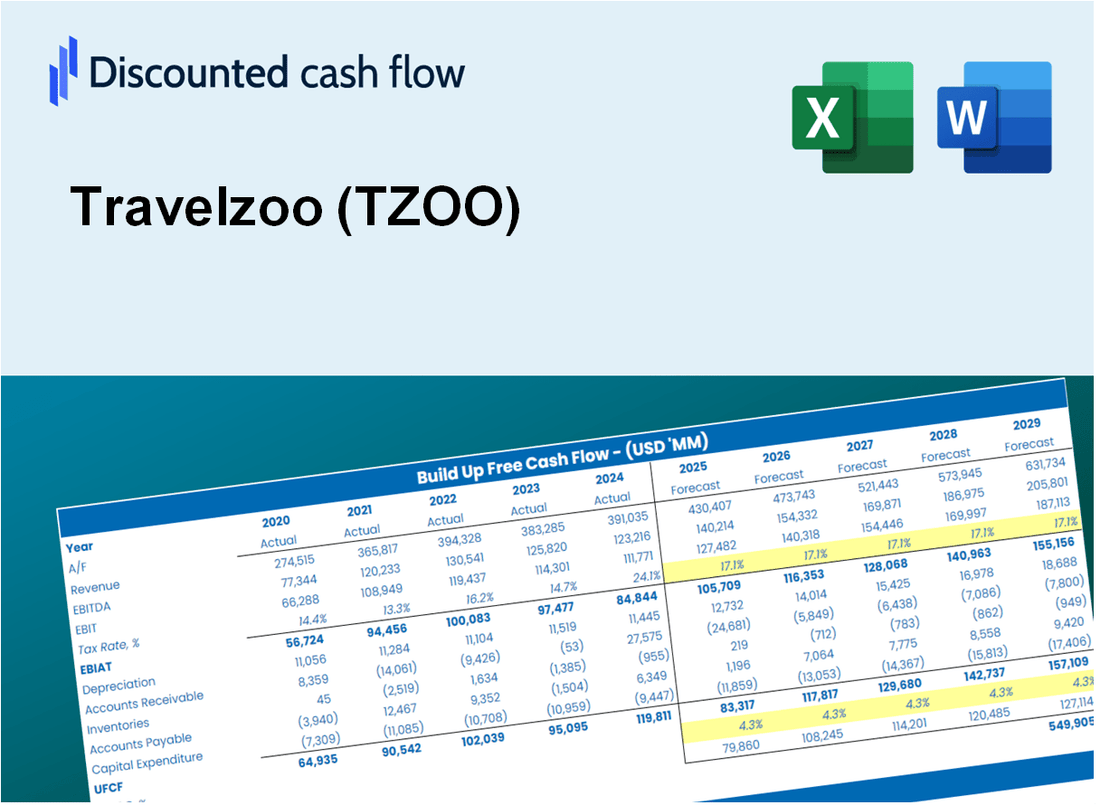
¡Obtenga información sobre su análisis de valoración de Travelzoo (Tzoo) con nuestra sofisticada calculadora DCF! Esta plantilla de Excel viene precisa con datos reales (TZOO), lo que le permite ajustar los pronósticos y supuestos para un cálculo preciso del valor intrínseco de Travelzoo.
Discounted Cash Flow (DCF) - (USD MM)
| Year | AY1 2020 |
AY2 2021 |
AY3 2022 |
AY4 2023 |
AY5 2024 |
FY1 2025 |
FY2 2026 |
FY3 2027 |
FY4 2028 |
FY5 2029 |
|---|---|---|---|---|---|---|---|---|---|---|
| Revenue | 53.6 | 62.7 | 70.6 | 84.5 | 83.9 | 94.1 | 105.5 | 118.3 | 132.7 | 148.8 |
| Revenue Growth, % | 0 | 17 | 12.58 | 19.66 | -0.68066 | 12.14 | 12.14 | 12.14 | 12.14 | 12.14 |
| EBITDA | -8.9 | .5 | 9.9 | 17.5 | 19.4 | 7.9 | 8.9 | 9.9 | 11.1 | 12.5 |
| EBITDA, % | -16.69 | 0.80846 | 14.09 | 20.67 | 23.13 | 8.4 | 8.4 | 8.4 | 8.4 | 8.4 |
| Depreciation | 2.3 | 1.8 | 2.2 | 1.9 | .9 | 2.6 | 2.9 | 3.2 | 3.6 | 4.1 |
| Depreciation, % | 4.32 | 2.9 | 3.1 | 2.24 | 1.08 | 2.73 | 2.73 | 2.73 | 2.73 | 2.73 |
| EBIT | -11.3 | -1.3 | 7.8 | 15.6 | 18.5 | 5.3 | 6.0 | 6.7 | 7.5 | 8.4 |
| EBIT, % | -21.01 | -2.09 | 10.99 | 18.43 | 22.05 | 5.67 | 5.67 | 5.67 | 5.67 | 5.67 |
| Total Cash | 63.1 | 43.8 | 18.7 | 15.7 | 17.1 | 44.3 | 49.6 | 55.7 | 62.4 | 70.0 |
| Total Cash, percent | .0 | .0 | .0 | .0 | .0 | .0 | .0 | .0 | .0 | .0 |
| Account Receivables | 4.5 | 14.9 | 14.1 | 13.0 | 12.8 | 15.6 | 17.4 | 19.6 | 21.9 | 24.6 |
| Account Receivables, % | 8.43 | 23.71 | 19.9 | 15.35 | 15.29 | 16.54 | 16.54 | 16.54 | 16.54 | 16.54 |
| Inventories | .0 | .0 | 2.9 | .0 | .0 | .8 | .9 | 1.0 | 1.1 | 1.2 |
| Inventories, % | 0 | 0 | 4.16 | 0 | 0 | 0.83231 | 0.83231 | 0.83231 | 0.83231 | 0.83231 |
| Accounts Payable | 7.0 | 72.1 | 4.3 | 25.2 | 6.1 | 29.4 | 33.0 | 37.0 | 41.4 | 46.5 |
| Accounts Payable, % | 13.05 | 114.95 | 6.05 | 29.79 | 7.32 | 31.24 | 31.24 | 31.24 | 31.24 | 31.24 |
| Capital Expenditure | -.3 | .0 | -1.5 | -.3 | -.2 | -.6 | -.7 | -.8 | -.8 | -.9 |
| Capital Expenditure, % | -0.47201 | -0.04624314 | -2.14 | -0.30186 | -0.21096 | -0.63426 | -0.63426 | -0.63426 | -0.63426 | -0.63426 |
| Tax Rate, % | 28.93 | 28.93 | 28.93 | 28.93 | 28.93 | 28.93 | 28.93 | 28.93 | 28.93 | 28.93 |
| EBITAT | -11.1 | -.4 | 5.2 | 11.3 | 13.1 | 3.7 | 4.1 | 4.6 | 5.2 | 5.8 |
| Depreciation | ||||||||||
| Changes in Account Receivables | ||||||||||
| Changes in Inventories | ||||||||||
| Changes in Accounts Payable | ||||||||||
| Capital Expenditure | ||||||||||
| UFCF | -6.6 | 56.1 | -64.1 | 37.8 | -5.0 | 25.4 | 7.9 | 8.9 | 9.9 | 11.1 |
| WACC, % | 7.71 | 7.57 | 7.65 | 7.66 | 7.65 | 7.65 | 7.65 | 7.65 | 7.65 | 7.65 |
| PV UFCF | ||||||||||
| SUM PV UFCF | 52.6 | |||||||||
| Long Term Growth Rate, % | 1.00 | |||||||||
| Free cash flow (T + 1) | 11 | |||||||||
| Terminal Value | 169 | |||||||||
| Present Terminal Value | 117 | |||||||||
| Enterprise Value | 169 | |||||||||
| Net Debt | -9 | |||||||||
| Equity Value | 178 | |||||||||
| Diluted Shares Outstanding, MM | 13 | |||||||||
| Equity Value Per Share | 13.88 |
What You Will Get
- Real TZOO Financials: Access to historical and projected data for precise valuation.
- Customizable Inputs: Adjust WACC, tax rates, revenue growth, and capital expenditures as needed.
- Dynamic Calculations: Intrinsic value and NPV are computed in real-time.
- Scenario Analysis: Explore various scenarios to assess Travelzoo's future performance.
- User-Friendly Design: Designed for professionals while remaining approachable for newcomers.
Key Features
- Customizable Travel Metrics: Adjust essential inputs such as booking rates, average revenue per user, and operational costs.
- Instant Trip Valuation: Quickly calculates intrinsic value, net present value, and other financial metrics.
- High-Precision Accuracy: Utilizes Travelzoo’s actual financial data for reliable valuation results.
- Effortless Scenario Testing: Easily explore various assumptions and analyze different outcomes.
- Efficiency Booster: Avoid the hassle of creating intricate valuation models from the ground up.
How It Works
- Step 1: Download the Excel file.
- Step 2: Review pre-entered Travelzoo (TZOO) data (historical and projected).
- Step 3: Adjust key assumptions (yellow cells) based on your analysis.
- Step 4: View automatic recalculations for Travelzoo’s intrinsic value.
- Step 5: Use the outputs for investment decisions or reporting.
Why Choose This Travelzoo Calculator?
- Accuracy: Real Travelzoo financials ensure data accuracy.
- Flexibility: Designed for users to test and modify inputs freely.
- Time-Saving: Skip the hassle of building a travel cost model from scratch.
- Professional-Grade: Developed with CFO-level precision and usability in mind.
- User-Friendly: Easy to use, even for those without advanced financial modeling experience.
Who Should Use This Product?
- Travel Industry Professionals: Develop comprehensive and accurate travel package valuations for market analysis.
- Corporate Strategy Teams: Evaluate travel trends and scenarios to inform business decisions.
- Travel Consultants and Advisors: Offer clients precise insights into the valuation of Travelzoo (TZOO) services.
- Students and Educators: Utilize real-time data to learn and teach about travel industry financial modeling.
- Travel Enthusiasts: Gain insights into how travel companies like Travelzoo (TZOO) are assessed in the market.
What the Template Contains
- Pre-Filled DCF Model: Travelzoo’s financial data preloaded for immediate use.
- WACC Calculator: Detailed calculations for Weighted Average Cost of Capital.
- Financial Ratios: Evaluate Travelzoo’s profitability, leverage, and efficiency.
- Editable Inputs: Change assumptions such as growth, margins, and CAPEX to fit your scenarios.
- Financial Statements: Annual and quarterly reports to support detailed analysis.
- Interactive Dashboard: Easily visualize key valuation metrics and results.
Disclaimer
All information, articles, and product details provided on this website are for general informational and educational purposes only. We do not claim any ownership over, nor do we intend to infringe upon, any trademarks, copyrights, logos, brand names, or other intellectual property mentioned or depicted on this site. Such intellectual property remains the property of its respective owners, and any references here are made solely for identification or informational purposes, without implying any affiliation, endorsement, or partnership.
We make no representations or warranties, express or implied, regarding the accuracy, completeness, or suitability of any content or products presented. Nothing on this website should be construed as legal, tax, investment, financial, medical, or other professional advice. In addition, no part of this site—including articles or product references—constitutes a solicitation, recommendation, endorsement, advertisement, or offer to buy or sell any securities, franchises, or other financial instruments, particularly in jurisdictions where such activity would be unlawful.
All content is of a general nature and may not address the specific circumstances of any individual or entity. It is not a substitute for professional advice or services. Any actions you take based on the information provided here are strictly at your own risk. You accept full responsibility for any decisions or outcomes arising from your use of this website and agree to release us from any liability in connection with your use of, or reliance upon, the content or products found herein.