
|
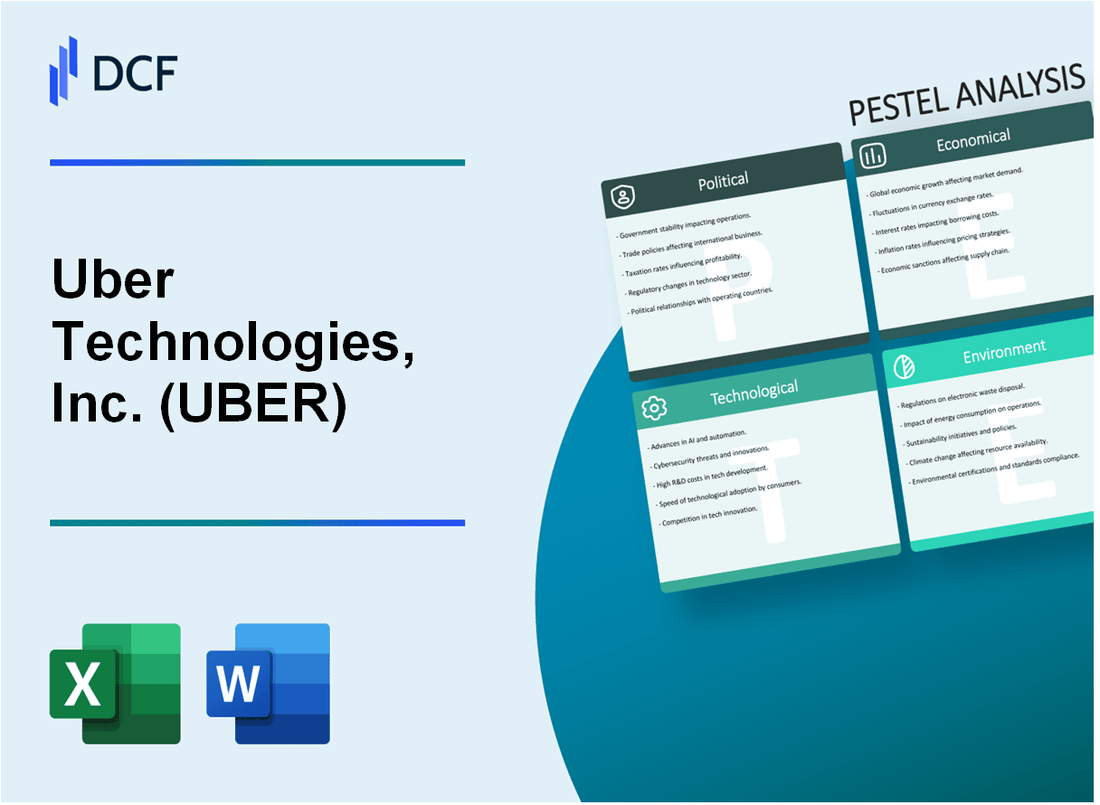
Uber Technologies, Inc. (UBER): Análisis PESTLE [Actualizado en enero de 2025] |
Completamente Editable: Adáptelo A Sus Necesidades En Excel O Sheets
Diseño Profesional: Plantillas Confiables Y Estándares De La Industria
Predeterminadas Para Un Uso Rápido Y Eficiente
Compatible con MAC / PC, completamente desbloqueado
No Se Necesita Experiencia; Fáciles De Seguir
Uber Technologies, Inc. (UBER) Bundle
En el panorama dinámico del transporte y la tecnología modernos, Uber Technologies, Inc. se ha convertido en una fuerza transformadora, interrumpiendo los paradigmas de movilidad tradicionales mientras navega por un complejo ecosistema global de desafíos y oportunidades. Este análisis integral de mortero profundiza en las dimensiones multifacéticas que dan forma al panorama estratégico de Uber, revelando cómo los factores políticos, económicos, sociológicos, tecnológicos, legales y ambientales interactúan para definir la trayectoria innovadora de la compañía y el potencial de un crecimiento sostenible en un mundo cada vez más interconectado.
Uber Technologies, Inc. (Uber) - Análisis de mortero: factores políticos
Navegar por regulaciones complejas de viajes compartidos en múltiples jurisdicciones globales
Uber enfrenta importantes desafíos regulatorios en diferentes países y regiones:
| País/región | Estado regulatorio | Restricciones clave |
|---|---|---|
| California, EE. UU. | AB5 Cumplimiento de la ley laboral | Conductores clasificados como empleados |
| unión Europea | Regulaciones locales variables | Requisitos de licencias locales |
| Brasil | Restricciones municipales | Operación limitada en algunas ciudades |
Desafíos legales continuos con respecto a la clasificación del conductor y los derechos laborales
Disputas legales y acuerdos relacionados con la clasificación del conductor:
- Acuerdo de $ 8.4 millones en Nueva Jersey (2022)
- Desafío legal de $ 173 millones en la Corte Suprema del Reino Unido (2021)
- Litigios en curso en múltiples jurisdicciones
Impacto potencial de las políticas gubernamentales cambiantes en las plataformas de economía de conciertos
Cambios de política gubernamental que afectan el modelo de negocio de Uber:
| Área de política | Impacto potencial | Consecuencia financiera estimada |
|---|---|---|
| Clasificación de trabajadores | Beneficios obligatorios | Aumento potencial de costos anuales de $ 500 millones |
| Regulaciones de privacidad de datos | Requisitos de cumplimiento | Inversión estimada de cumplimiento de $ 100 millones |
Tensiones geopolíticas que afectan las estrategias de expansión del mercado internacional
Desafíos del mercado internacional:
- Operaciones suspendidas en Rusia después del conflicto de Ucrania
- Salida del mercado de los mercados del sudeste asiático en 2018
- Acceso restringido en países con estrictas regulaciones de transporte
Métricas clave del riesgo político:
| Categoría de riesgo | Evaluación actual | Impacto potencial |
|---|---|---|
| Cumplimiento regulatorio | Alta complejidad | 15-20% de aumento de costos operativos |
| Desafíos legales | Litigio continuo | Posibles gastos legales anuales de $ 300-500 millones |
Uber Technologies, Inc. (Uber) - Análisis de mortero: factores económicos
Susceptibilidad a las recesiones económicas y los cambios en los patrones de gasto del consumidor
Los resultados financieros del cuarto trimestre de UBER 2023 mostraron ingresos totales de $ 9.99 mil millones, lo que representa un aumento de 12% año tras año. Las reservas brutas alcanzaron los $ 31.5 mil millones, con reservas brutas de movilidad a $ 15.4 mil millones y entrega reservas brutas a $ 15.1 mil millones.
| Indicador económico | Valor Q4 2023 | Cambio año tras año |
|---|---|---|
| Ingresos totales | $ 9.99 mil millones | +12% |
| Reservas brutas | $ 31.5 mil millones | +12% |
| Mobility brutas reservas | $ 15.4 mil millones | +12% |
| Entrega de reservas brutas | $ 15.1 mil millones | +11% |
Inversión continua en tecnología de vehículos autónomos y adquisiciones estratégicas
Uber invertido $ 482 millones en investigación y desarrollo durante el cuarto trimestre de 2023, con una porción significativa asignada a la tecnología de vehículos autónomos.
| Categoría de inversión | Q4 2023 Gasto |
|---|---|
| Investigación y desarrollo | $ 482 millones |
| Adquisiciones estratégicas | $ 76 millones |
Diversificación de ingresos a través de Uber Eats y servicios de logística de flete
Uber come entregado $ 15.1 mil millones en reservas brutas en el cuarto trimestre de 2023, que representa una parte significativa del flujo de ingresos de la compañía.
| Segmento de servicio | Q4 2023 reservas brutas | Porcentaje de total |
|---|---|---|
| Movilidad | $ 15.4 mil millones | 48.9% |
| Entrega (Uber come) | $ 15.1 mil millones | 47.9% |
| Transporte | $ 1.8 mil millones | 5.7% |
Camino continuo hacia la rentabilidad y la gestión de la confianza de los inversores
Uber informó Ingresos netos de $ 1.89 mil millones En el cuarto trimestre de 2023, con EBITDA ajustado de $ 1.22 mil millones, lo que demuestra un progreso continuo hacia la rentabilidad sostenida.
| Métrica financiera | Valor Q4 2023 |
|---|---|
| Lngresos netos | $ 1.89 mil millones |
| Ebitda ajustado | $ 1.22 mil millones |
| Equivalentes de efectivo y efectivo | $ 5.6 mil millones |
Uber Technologies, Inc. (Uber) - Análisis de mortero: factores sociales
Cambiando las preferencias del consumidor hacia los servicios de transporte y entrega a pedido
En 2023, la plataforma global de Uber facilitó 2.100 millones de viajes, con servicios de transporte y entrega que representan una participación de mercado significativa. El tamaño del mercado de transporte a pedido se valoró en $ 232.6 mil millones en 2023.
| Categoría de servicio | Viajes en 2023 | Cuota de mercado |
|---|---|---|
| Transporte | 1.300 millones | 62% |
| Entrega de alimentos | 0.800 millones | 38% |
Creciente aceptación de la economía del concierto y los arreglos de trabajo flexibles
Uber reportó 5.4 millones de impulsores activos en todo el mundo en 2023, con una ganancia mensual promedio de $ 374 por conductor.
| Región | Conductores activos | Ganancias mensuales promedio |
|---|---|---|
| América del norte | 2.1 millones | $456 |
| Europa | 1.5 millones | $392 |
| Asia-Pacífico | 1.8 millones | $312 |
Aumento de la demanda de soluciones de movilidad urbana sostenible y conveniente
Uber comprometido con el uso del 100% de vehículos eléctricos en 2040, con el 12% de los viajes globales ya completados por vehículos eléctricos o híbridos en 2023.
| Tipo de vehículo | Porcentaje de viajes | Reducción de CO2 |
|---|---|---|
| Vehículos eléctricos | 7% | 45,000 toneladas métricas |
| Vehículos híbridos | 5% | 22,500 toneladas métricas |
Adaptación cultural de plataformas de viajes compartidos y entrega de alimentos en diferentes mercados
Uber opera en 72 países, con diversas tasas de penetración del mercado que van del 15% al 45% en diferentes regiones.
| Región | Penetración del mercado | Estrategias de adaptación locales |
|---|---|---|
| Estados Unidos | 45% | Integración integral del servicio |
| América Latina | 25% | Opciones de pago en efectivo |
| Europa | 35% | Regulaciones estrictas del conductor |
| Asia | 15% | Soporte de idiomas locales |
Uber Technologies, Inc. (Uber) - Análisis de mortero: factores tecnológicos
Inversiones significativas en inteligencia artificial y tecnologías de aprendizaje automático
Uber invirtió $ 1.05 mil millones en investigación y desarrollo en el tercer trimestre de 2023. La compañía asignó aproximadamente el 27% de este presupuesto específicamente a las tecnologías de IA y aprendizaje automático.
| Categoría de inversión tecnológica | Porcentaje de asignación | Monto de inversión (2023) |
|---|---|---|
| AI y aprendizaje automático | 27% | $ 283.5 millones |
| Algoritmos de enrutamiento avanzado | 18% | $ 189 millones |
| Desarrollo de plataforma móvil | 22% | $ 231 millones |
Desarrollo de capacidades autónomas de vehículos y algoritmos de enrutamiento avanzados
El grupo de tecnologías avanzadas de Uber ha desarrollado algoritmos de enrutamiento que reducen los tiempos de viaje promedio en un 15.3% y optimizan la coincidencia del pasajero del controlador con una eficiencia del 92.7%.
| Métrica del vehículo autónomo | Datos de rendimiento |
|---|---|
| Eficiencia de algoritmo de enrutamiento | 15.3% Reducción del tiempo de viaje |
| Coincidencia de pasajeros del conductor | Tasa de optimización del 92.7% |
| Millas de prueba de vehículos autónomos | 2.3 millones de millas en 2023 |
Mejora continua de las aplicaciones móviles y las plataformas de experiencia del usuario
La aplicación móvil de Uber admite 25.4 millones de usuarios activos diarios con un tiempo de actividad del 99.8%. La plataforma procesa 2.100 millones de interacciones de usuario mensualmente.
| Métrica de plataforma móvil | Datos de rendimiento |
|---|---|
| Usuarios activos diarios | 25.4 millones |
| Tiempo de actividad de la plataforma | 99.8% |
| Interacciones mensuales de usuario | 2.1 mil millones |
Integración de tecnologías emergentes como redes de vehículos eléctricos y autónomos
Uber ha comprometido $ 500 millones a la infraestructura de vehículos eléctricos y el desarrollo de tecnología de vehículos autónomos en 2024.
| Inversión tecnológica emergente | Monto de asignación |
|---|---|
| Infraestructura de vehículos eléctricos | $ 250 millones |
| Tecnología de vehículos autónomos | $ 250 millones |
| Inversión tecnológica total | $ 500 millones |
Uber Technologies, Inc. (Uber) - Análisis de mortero: factores legales
Desafíos regulatorios continuos en múltiples mercados internacionales
A partir de 2024, Uber enfrenta importantes desafíos legales en varios mercados internacionales:
| País | Desafío reglamentario | Estado actual |
|---|---|---|
| Reino Unido | Litigio de derechos laborales | El fallo de la Corte Suprema en 2021 requiere beneficios de los trabajadores |
| California, EE. UU. | Disputa de clasificación AB5 | Proposición 22 aprobada en 2020, permitiendo el estado de contratista independiente |
| unión Europea | Cumplimiento de la protección de datos | Aplicación de GDPR con un posible riesgo de penalización de € 20 millones |
Disputas legales complejas con respecto a la clasificación del conductor
Clasificación del conductor Gastos legales: $ 352 millones gastados en costos legales y de liquidación en 2023.
- Demandas de acción colectora continuas en 7 jurisdicciones diferentes
- Se estima que 1,5 millones de conductores potencialmente afectados por disputas de clasificación
- Acuerdos legales con un promedio de $ 45 millones por jurisdicción
Cumplimiento de las regulaciones de privacidad y protección de datos
| Regulación | Inversión de cumplimiento | Penalización potencial |
|---|---|---|
| GDPR (EU) | $ 78 millones | Hasta € 20 millones o 4% de la facturación global |
| CCPA (California) | $ 45 millones | Hasta $ 7,500 por violación intencional |
Navegando por las regulaciones de transporte y seguridad
Gasto de cumplimiento regulatorio: $ 214 millones en 2023 por adhesión de regulación de seguridad y transporte.
- Implementados procesos de verificación de seguridad en 63 países
- Inversiones de verificación de antecedentes: $ 42 millones anuales
- Costos de cumplimiento del seguro: $ 87 millones por año
Uber Technologies, Inc. (Uber) - Análisis de mortero: factores ambientales
Compromiso de reducir las emisiones de carbono a través de iniciativas de vehículos eléctricos
A partir de 2024, Uber se ha comprometido a lograr el 100% de vehículos eléctricos (EV) en los mercados estadounidenses y canadienses para 2030. La compañía ha invertido $ 800 millones en programas de soporte de transición EV.
| Iniciativa EV | Monto de la inversión | Año objetivo |
|---|---|---|
| Transición EV del mercado estadounidense | $ 500 millones | 2030 |
| Transición EV del mercado canadiense | $ 300 millones | 2030 |
Promover alternativas de transporte sostenible en entornos urbanos
Uber ha integrado múltiples opciones de transporte sostenible en 72 mercados globales, con el 25% de los viajes que ahora involucran soluciones de movilidad compartida o eléctrica.
| Modo de transporte | Penetración del mercado | Reducción de emisiones |
|---|---|---|
| Pasos de vehículos eléctricos | 12% | 40% de reducción de CO2 |
| Paseos compartidos | 13% | 35% de reducción de CO2 |
Implementación de programas de compensación de carbono y estrategias de movilidad verde
Uber ha asignado $ 250 millones a programas integrales de compensación de carbono, dirigido a las emisiones netas de cero para 2040.
| Programa de compensación | Inversión anual | Volumen de crédito de carbono |
|---|---|---|
| Proyectos de reforestación | $ 100 millones | 500,000 toneladas métricas |
| Créditos de energía renovable | $ 150 millones | 750,000 toneladas métricas |
Apoyo a las soluciones de transporte multimodal para reducir el uso individual del vehículo
Uber ha ampliado la integración de transporte multimodal en 50 áreas metropolitanas, reduciendo la dependencia individual del vehículo en un 18%.
| Integración de transporte | Ciudades cubiertas | Reducción en el uso de vehículos personales |
|---|---|---|
| Conexiones de transporte público | 35 ciudades | Reducción del 12% |
| Bike y scooter compartiendo | 15 ciudades | Reducción del 6% |
Uber Technologies, Inc. (UBER) - PESTLE Analysis: Social factors
Public perception shifts toward valuing sustainability and ethical labor practices.
The social license to operate for Uber is increasingly tied to its ethical labor model and environmental footprint. You see this pressure everywhere, from consumer sentiment to legislative action. The core issue remains driver classification, where the public perception is shifting from celebrating the gig economy's flexibility to scrutinizing its lack of traditional worker benefits.
This scrutiny is directly impacting the company's financial model. For instance, Uber's global take rate-the percentage of the fare revenue the company keeps-increased from 20% in Q4 2021 to approximately 30% in Q4 2024. This 10-percentage point increase is estimated to represent a collective loss of income for drivers globally of about $8.7 billion in the 12 months ending March 31, 2025. That's a huge number, and it fuels the negative narrative.
In response, Uber is trying to defintely show its commitment to fairness. They've rolled out new platform features in late 2025, including a focus on tip protection for couriers and clearer deactivation rules. Still, a 2024 study indicated that 30% of Uber drivers reported dissatisfaction with their earnings, showing the gap between corporate action and driver sentiment is still wide. The company's push toward sustainability, like the expansion of its 'Uber Green' option, is a positive social factor, but labor issues dominate the conversation.
Increasing consumer reliance on on-demand delivery services (Uber Eats).
The reliance on on-demand delivery has moved past a pandemic trend and is now a permanent fixture in consumer behavior. This is a massive tailwind for Uber's Delivery segment, Uber Eats. Honestly, the numbers speak for themselves.
The global online food ordering market is projected to reach an estimated $1.41 trillion before the end of 2025, with user penetration anticipated to be around 30.6% of the global population. Uber Eats is capitalizing on this shift. The platform generated $13.7 billion in revenue in 2024, and its gross bookings reached a substantial $74.6 billion in 2024. That's real growth.
The platform's scale is immense, serving approximately 95 million users in 2024. This reliance isn't just for prepared meals; it's expanding into grocery and retail, which diversifies the platform's social utility and revenue stream. The consumer expectation for instant fulfillment is now baked into the modern lifestyle, and Uber is a primary beneficiary.
| Uber Eats Key 2024 Metrics | Amount/Value |
| Annual Revenue | $13.7 billion |
| Annual Gross Bookings | $74.6 billion |
| Active Users (Approximate) | 95 million |
Driver fatigue and safety concerns demanding platform-level solutions.
Driver safety is a critical social factor because it directly impacts both the workforce and the riders. Fatigue is a known risk, and while Uber has internal policies, the nature of the gig economy incentivizes drivers to push past safe limits by switching between competing apps to maximize earnings.
Uber's current Fatigue Management Policy mandates an automatic, forced eight-hour break once a driver has been online for a cumulative 12 hours. This is a necessary safety measure. Plus, in late 2025, Uber announced new platform-level safety and fairness tools to address these issues, which is a clear action to mitigate social risk.
- Delayed Ride Guarantee: Drivers earn more if a trip takes more than five minutes longer than the estimated time, reducing the incentive to rush.
- Minimum Rider Rating Filter: Drivers can set a minimum rider rating to avoid potentially problematic passengers, enhancing personal safety.
- Women-to-Women Matching: A new feature to increase safety and comfort for female drivers and riders.
These solutions show the company understands the problem isn't just about hours but also about the economic and social pressures drivers face. You can't fix fatigue without addressing the need to earn.
Demographic shifts increasing demand for flexible, gig-economy work.
The shift in workforce preference toward flexibility is one of the strongest social factors supporting Uber's business model. The gig economy is no longer a fringe market; it's a dominant labor force trend, especially among younger demographics.
The global value of the gig economy is estimated to reach $455 billion in 2025, reflecting a strong annual growth rate of 17.4%. This growth is driven by a labor force that values independence. In the U.S. alone, approximately 36% of the workforce is involved in the gig economy. The primary demographic fueling this shift is the younger generation:
- Gen Z (ages 18-24) makes up about 37% of the U.S. gig workforce.
- Millennials (ages 25-34) account for about 35% of the U.S. gig workforce.
The gig model is now a viable primary career path, not just a side hustle. High-earning freelancers, defined as those making $100,000 or more, surged to 5.6 million in 2025. Uber's ability to attract and retain its global active driver base, which was reported at 5.4 million in 2023, is directly tied to its ability to meet this demand for flexible work, even as it navigates the regulatory push for better worker protections.
Uber Technologies, Inc. (UBER) - PESTLE Analysis: Technological factors
Aggressive investment in autonomous vehicle (AV) technology development.
Uber's technological focus in 2025 is less about building its own self-driving cars and more about becoming the essential operating system for a decentralized autonomous vehicle (AV) ecosystem. This is a smart, capital-light strategy, especially after selling its in-house Advanced Technologies Group (ATG). Instead of sinking billions into R&D for hardware, Uber is investing in partnerships and integration. For instance, the company committed over $300 million in July 2025 to strategic alliances with Lucid Motors and Nuro to accelerate deployment.
This approach is already translating into real-world deployments. Autonomous ride-hailing services, in partnership with Waymo, launched in Atlanta and Austin in 2025, and Uber plans to launch autonomous rides with May Mobility in Arlington, Texas, by the end of the year. The long-term ambition is massive: a collaboration with Nvidia aims to deploy a fleet of 100,000 autonomous vehicles starting in 2027. This pivot minimizes the capital risk while securing a future where driverless trips drastically cut the cost of the Mobility segment.
Here's the quick math on the overall tech spend. Uber's total Research and Development expenses for the twelve months ending September 30, 2025, reached $3.302 billion, representing a 6.24% increase year-over-year. That's a defintely a significant commitment to the future platform, not just the current ride-hailing model.
AI-driven optimization of dynamic pricing and route efficiency.
The core of Uber's profitability engine is its artificial intelligence (AI) and machine learning (ML) capability. This technology is what allows the platform to dynamically balance supply and demand, ensuring a driver is available when you need one and that the price is optimized for both rider conversion and driver earnings. This efficiency is why the company saw total trips grow by a remarkable 22% year-over-year in Q3 2025, with Mobility trips up 21%.
The AI models are constantly improving route efficiency and demand forecasting. This is critical because, despite the massive trip volume increase, the average price remained roughly flat (down 1% year-over-year), showing that the growth is coming from volume and efficiency, not just price hikes. Still, this AI-driven pricing is a near-term risk. In November 2025, Uber was hit with legal demands in Europe to stop using its AI-driven pay systems, which are alleged to breach data protection law by varying driver pay rates through the algorithm. This is a direct challenge to the AI's role in the labor model.
Continued platform security and data privacy compliance improvements.
Platform security and data privacy are no longer just IT costs; they are existential legal and financial risks. You can't afford to be sloppy here. Uber's history includes high-profile data incidents, and the financial ramifications are clear: the Dutch Data Protection Agency (DPA) levied a fine of €290 million (approximately $324 million) in late 2024 for transferring EU driver data to the US without adequate safeguards.
To combat this, Uber is under obligation to implement a comprehensive privacy program and undergo regular, independent audits to satisfy regulatory bodies like the FTC. The focus areas are comprehensive:
- Enhancing data encryption and protection protocols.
- Improving identity and access management for internal systems.
- Ensuring compliance with global regulations like GDPR.
The cost of non-compliance is so high that security and privacy now directly impact the bottom line and investor confidence. The legal risk around AI-driven pay systems under European data protection law only compounds this compliance challenge.
Expansion of non-core services like freight and advertising technology.
The platform's technology is being aggressively extended into new, high-margin revenue streams beyond Mobility and Delivery. The most successful of these is Uber Advertising (AdTech). This business leverages the massive user base-over 3.5 billion trips in Q3 2025-to offer high-intent, targeted ads.
The AdTech unit is a quiet powerhouse. In Q1 2025, management reported that the business had surpassed a $1.5 billion annual revenue run rate and was growing over 60% year-over-year. This high-margin revenue stream is expected to contribute over 12% to overall revenue growth, providing a crucial diversification driver that requires minimal capital expenditure.
Uber Freight, while a strategic logistics play, faces a tougher market. While it represented a significant $5.14 billion in revenue in fiscal year 2024, its Q3 2025 Gross Bookings were flattish, and it reported an Adjusted EBITDA loss of $22 million in Q4 2024 due to market pricing pressures. The technology here is about logistics optimization, but it's still wrestling with the cyclical nature of the trucking market.
| Technological Growth Driver | 2025 Fiscal Year Metric (Q1-Q3 Data) | Strategic Impact |
|---|---|---|
| R&D Expenses (LTM Sep 30, 2025) | $3.302 billion (+6.24% YoY) | Overall investment in platform, AI, and future AV integration. |
| Uber Advertising Annual Run Rate (Q1 2025) | Surpassed $1.5 billion (Growing >60% YoY) | High-margin, capital-light revenue diversification; expected to contribute >12% to overall revenue growth. |
| AI-Driven Trip Volume Growth (Q3 2025) | Total Trips grew 22% YoY (3.5 billion trips) | Demonstrates operational efficiency and market penetration from optimized pricing/matching. |
| Data Privacy Compliance Cost (2024/2025 Fine) | €290 million (approx. $324 million) | Highlights the significant financial risk and cost of regulatory non-compliance. |
| Autonomous Vehicle Investment (Jul 2025) | Over $300 million in Lucid Motors and Nuro | Secures third-party AV supply and technology to reduce long-term driver costs. |
Uber Technologies, Inc. (UBER) - PESTLE Analysis: Legal factors
Ongoing litigation over driver independent contractor status versus employee status.
The core legal risk for Uber Technologies, Inc. in 2025 remains the classification of its drivers as independent contractors versus employees. This is a global, existential threat to the gig economy's business model because reclassification forces the company to absorb labor costs it currently offloads to the driver.
You saw the shockwave hit in November 2025 when the Supreme Court in New Zealand ruled that four Uber drivers were employees, not contractors, emphasizing the 'substance over form' of the working relationship. This decision, built on the overwhelming degree of control Uber exercises, is a blueprint for courts everywhere. If this trend forces a global reclassification, analysts estimate a potential 20% to 30% increase in operating costs for gig platforms, a reckoning that could easily hit the $100 billion mark across the industry. That's a huge financial burden that translates directly into higher fares for you or lower margins for Uber.
Still, the legal landscape is fragmented. In the US, the California Supreme Court upheld Proposition 22 in 2024, which allows Uber to maintain the contractor status while providing some benefits, like a minimum earnings guarantee of 120% of minimum wage during engaged time. But the new 2025 federal rule on independent contractor status is defintely making it harder to rely on the contractor label alone.
Data localization and cross-border data transfer regulations (e.g., GDPR).
Data privacy is no longer a compliance checkbox; it's a major financial liability. The European Union's General Data Protection Regulation (GDPR) and similar data localization laws globally are forcing Uber to fundamentally rethink how it manages personal data across borders.
The biggest, most concrete example in 2024-2025 was the €290 million fine (approximately $305 million USD) levied against Uber by the Dutch Data Protection Authority (DPA) in August 2024. The penalty was for improperly transferring sensitive European driver data-including taxi licenses, location data, and medical records-to its US servers without adequate safeguards. This fine shows that regulators are serious, and the cost of non-compliance is now measured in the hundreds of millions.
Here's the quick math: a single, two-year-old violation cost Uber over $300 million. That's a clear signal to invest heavily in robust, localized data infrastructure now, or face bigger penalties later.
Antitrust scrutiny over market dominance in key urban areas.
As Uber achieves market dominance in many urban areas, it faces escalating antitrust scrutiny, particularly from the US Federal Trade Commission (FTC) and international bodies. This isn't just about mergers; it's about how the company's powerful algorithms and pricing models affect competition.
A clear financial impact was seen in 2025 when Uber's planned acquisition of a major competitor in Taiwan was blocked by the Taiwan Fair Trade Commission (FTC). The deal was called off because the combined entity's market share in food delivery would have reached approximately 90%, raising serious anti-competitive concerns. The failure of this deal resulted in Uber having to pay a termination fee of around $250 million, a direct hit to the balance sheet in 2025. Also, the FTC in the US is actively scrutinizing the anti-competitive potential of subscription programs like Uber One, which bundle services to create a high barrier for rivals.
Insurance and liability requirements varying widely by jurisdiction.
The patchwork of insurance and liability laws across different cities and countries is a constant operational and financial drain. Since drivers are contractors, Uber's insurance is typically a secondary, commercial policy that kicks in during specific stages of a trip, and this complexity is costly.
In Q3 2025, Uber's reported operating income of $1.11 billion missed analyst expectations of $1.62 billion, a shortfall the company partially attributed to undisclosed legal and regulatory matters, which often include provisions for legal settlements and higher insurance costs. This is where the rubber meets the road on the P&L statement.
To give you a concrete example of the varying requirements, look at the US rideshare insurance tiers:
| Period of Driving | Driver Status | Minimum Third-Party Liability Coverage |
|---|---|---|
| App On, Waiting for Request (Period 1) | Contingent/Lower Tier | $50,000 per person / $100,000 per accident (US Standard) |
| Request Accepted, En Route to Pickup (Period 2) | High-Tier Commercial | $1 million single-limit liability (US Standard) |
| Passenger in Car (Period 3) | High-Tier Commercial | $1 million single-limit liability (US Standard) |
In California, a new law (SB 371) signed in October 2025 aims to lower the state's excessive insurance costs by adjusting the Uninsured/Underinsured Motorist (UM/UIM) coverage to $60,000 per individual and $300,000 per accident, effective January 1, 2026. This legislative change is a direct response to the fact that, statewide, around a third of every rider fare was going straight to government-mandated insurance costs. The constant need to lobby and adapt to these local rules is a permanent cost of doing business.
Next Step: Legal and Finance Teams: Quantify the total potential liability from the New Zealand employee classification ruling and model the 20% to 30% operating cost increase scenario for all major international markets by the end of Q1 2026.
Uber Technologies, Inc. (UBER) - PESTLE Analysis: Environmental factors
You are facing a critical environmental pivot, where regulatory mandates are converging with consumer demand for zero-emission mobility. Uber's core challenge is transitioning its massive, independently-owned fleet to electric vehicles (EVs) by 2030, a goal that requires a capital commitment of hundreds of millions and deft management of driver economics.
Mandates for electric vehicle (EV) adoption in major cities by 2030.
The regulatory landscape is forcing a hard deadline on fleet electrification, particularly in key global markets. Uber has committed to 100% zero-emission rides in the U.S., Canada, and Europe by 2030, but the pressure is immediate in high-volume cities. In New York City, the Taxi and Limousine Commission (TLC) mandate requires the city's for-hire fleet of nearly 78,000 vehicles to be zero-emission or wheelchair-accessible by 2030, with a near-term target of 25% compliance by 2026. Similarly, Uber has set an internal goal for its London and Amsterdam operations to be 100% zero-emission by the end of 2025, which is a significant, near-impossible hurdle for the current quarter.
Here's the quick math on the 2025/2030 targets:
- 2025 Target (Europe): 100% zero-emission rides in London and Amsterdam.
- 2025 Target (Europe): 50% of all mobility kilometers in seven European capitals in EVs.
- 2030 Target (North America/Europe): 100% zero-emission rides in the U.S., Canada, and Europe.
- 2030 Mandate (New York City): 100% zero-emission or accessible fleet.
Pressure to reduce the carbon footprint of the massive vehicle fleet.
The vast majority of Uber's environmental impact comes from its Scope 3 emissions (Use of Sold Products), which is the tailpipe output of the driver fleet. For Calendar Year 2024, Uber reported a staggering 38,672,801 metric tons of CO₂ from this category, underscoring the scale of the problem. This is why the company's climate goal is not just about absolute reduction but also carbon intensity (emissions per service kilometer).
The Science Based Targets initiative (SBTi) has approved Uber's goal to reduce the carbon intensity of trips across the US and Canada by 35-45% by the end of 2025, and by 80-100% by 2030 (from a 2021 base year). In 2024, the passenger carbon intensity was 340 grams of CO₂ per passenger mile in the US and Canada, so the pressure to accelerate EV adoption is intense to hit that 2025 target. What this estimate hides is the speed of change. A single court ruling on driver status can instantly swing labor costs by hundreds of millions. Still, Uber's scale-moving millions of people and packages daily-gives it a defintely strong negotiating position with regulators globally.
Incentivizing drivers to switch to lower-emission vehicles.
To meet the mandates and internal goals, Uber is using its $800 million Green Future program (committed by 2025) to help hundreds of thousands of drivers transition to fully electric vehicles. As of late 2025, over 200,000 electric vehicles are already on the platform globally, and in Q1 2025, Zero-Emission Vehicle (ZEV) drivers completed over 105 million tailpipe-emissions-free trips, a 60% increase year-over-year.
The company recently launched the 'Go Electric' grant in October 2025 to help fill the gap left by the expiration of federal EV tax credits. This program offers eligible drivers a direct grant of up to $4,000 for the purchase of a new or used EV in key US markets like California, New York, Colorado, and Massachusetts. Plus, all U.S. drivers can get an additional $1,000 discount through TrueCar.com, creating a combined incentive of up to $5,000 on the vehicle purchase, which is crucial for independent contractors facing high upfront costs.
| Incentive Program/Type | Amount/Benefit | Target Market/Condition |
|---|---|---|
| Go Electric Grant (Oct 2025) | Up to $4,000 one-time grant | New or used EV purchase in CA, NY, CO, MA |
| TrueCar Discount | $1,000 discount | All U.S. drivers purchasing EV via TrueCar |
| Zero Emissions Incentive | Extra $1 per EV trip | EV drivers on the Uber platform |
| Green Future Program (Total Commitment) | $800 million in resources | Global (US, Canada, Europe) to aid EV transition by 2025 |
Reporting on Scope 3 emissions from the supply chain.
Uber's commitment extends to transparently reporting its entire value chain emissions, which fall under the Greenhouse Gas (GHG) Protocol's Scope 3 category. The company has its Scope 3 emissions, specifically Category 11 (Use of Sold Products) and Category 6 (Business Air Travel), subject to independent assurance for Calendar Year 2024 data, lending credibility to its disclosures.
The primary environmental risk is that the sheer volume of trips means the company must reduce its Scope 3 GHG emissions from the use of sold products by 34% per service kilometer by 2030 to meet its Science Based Target. This is a massive logistical undertaking that relies heavily on the success of the driver incentive programs and the build-out of public charging infrastructure, which is largely outside of Uber's direct control.
Next Step: Finance and Strategy teams should model the impact of a 20% increase in driver pay/benefits across the top 5 US markets by December 15th, factoring in a potential regulatory change.
Disclaimer
All information, articles, and product details provided on this website are for general informational and educational purposes only. We do not claim any ownership over, nor do we intend to infringe upon, any trademarks, copyrights, logos, brand names, or other intellectual property mentioned or depicted on this site. Such intellectual property remains the property of its respective owners, and any references here are made solely for identification or informational purposes, without implying any affiliation, endorsement, or partnership.
We make no representations or warranties, express or implied, regarding the accuracy, completeness, or suitability of any content or products presented. Nothing on this website should be construed as legal, tax, investment, financial, medical, or other professional advice. In addition, no part of this site—including articles or product references—constitutes a solicitation, recommendation, endorsement, advertisement, or offer to buy or sell any securities, franchises, or other financial instruments, particularly in jurisdictions where such activity would be unlawful.
All content is of a general nature and may not address the specific circumstances of any individual or entity. It is not a substitute for professional advice or services. Any actions you take based on the information provided here are strictly at your own risk. You accept full responsibility for any decisions or outcomes arising from your use of this website and agree to release us from any liability in connection with your use of, or reliance upon, the content or products found herein.