
|
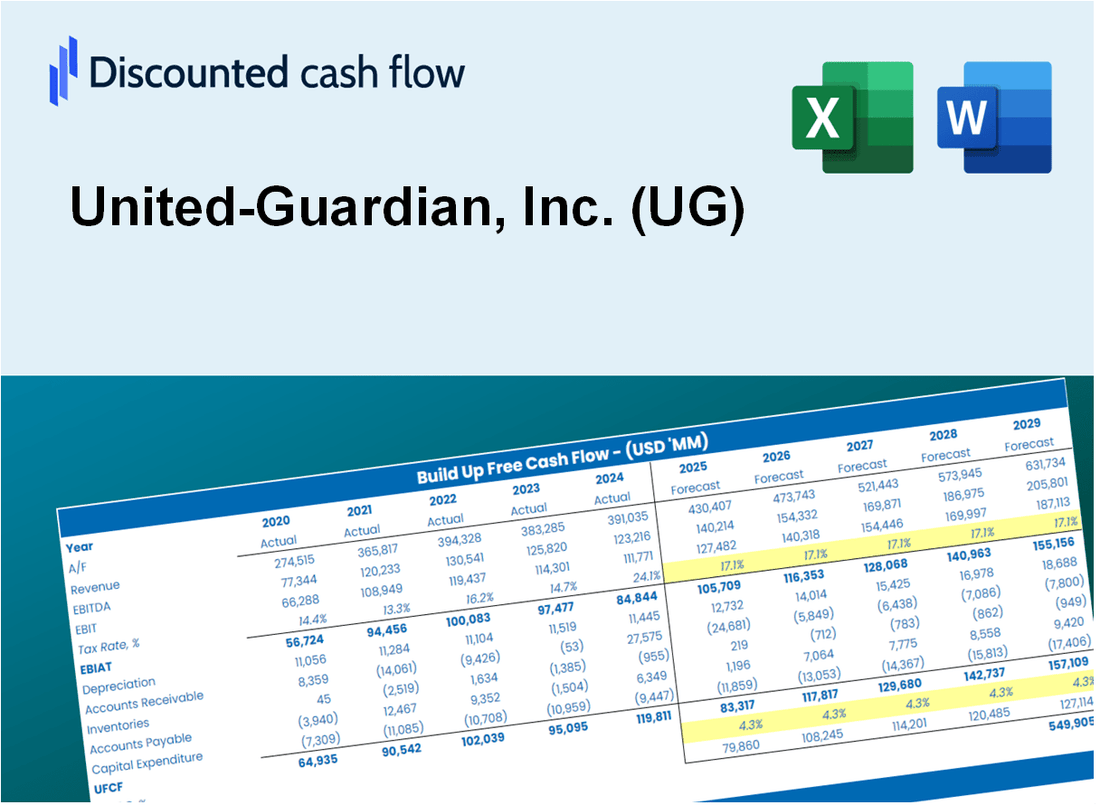
Valoración DCF de United-Guardian, Inc. (UG) |
Completamente Editable: Adáptelo A Sus Necesidades En Excel O Sheets
Diseño Profesional: Plantillas Confiables Y Estándares De La Industria
Predeterminadas Para Un Uso Rápido Y Eficiente
Compatible con MAC / PC, completamente desbloqueado
No Se Necesita Experiencia; Fáciles De Seguir
United-Guardian, Inc. (UG) Bundle
Ya sea que sea un inversor o analista, esta calculadora DCF (UG) es su herramienta de referencia para una valoración precisa. Con datos reales de United-Guardian, Inc., puede ajustar las previsiones y observar los resultados en tiempo real.
What You Will Receive
- Comprehensive Financial Model: United-Guardian, Inc.'s (UG) actual data facilitates accurate DCF valuation.
- Complete Forecast Control: Modify revenue growth, profit margins, WACC, and other essential drivers.
- Immediate Calculations: Real-time updates provide instant feedback as adjustments are made.
- Professional-Grade Template: A polished Excel file crafted for high-quality valuation presentations.
- Flexible and Reusable: Designed for adaptability, allowing for repeated application in detailed forecasting.
Key Features
- Customizable Financial Inputs: Adjust key metrics such as revenue projections, profit margins, and investment levels.
- Instant DCF Valuation: Quickly computes intrinsic value, net present value, and additional financial metrics.
- High-Precision Analysis: Leverages United-Guardian, Inc.'s (UG) actual financial data for accurate valuation results.
- Effortless Scenario Modeling: Easily explore various assumptions and evaluate different outcomes.
- Efficiency Booster: Streamlines the valuation process, removing the need for intricate model construction.
How It Works
- Step 1: Download the Excel file.
- Step 2: Review pre-entered United-Guardian, Inc. (UG) data (historical and projected).
- Step 3: Adjust key assumptions (yellow cells) based on your analysis.
- Step 4: View automatic recalculations for United-Guardian, Inc. (UG)’s intrinsic value.
- Step 5: Use the outputs for investment decisions or reporting.
Why Choose This Calculator for United-Guardian, Inc. (UG)?
- All-in-One Solution: Combines DCF, WACC, and financial ratio analyses tailored for United-Guardian, Inc. (UG).
- Flexible Inputs: Modify yellow-highlighted cells to explore different financial scenarios.
- In-Depth Analysis: Automatically computes United-Guardian, Inc. (UG)'s intrinsic value and Net Present Value.
- Preloaded Information: Historical and projected data provide reliable starting points for analysis.
- Expert-Level Tool: Perfect for financial analysts, investors, and business consultants focusing on United-Guardian, Inc. (UG).
Who Should Use United-Guardian, Inc. (UG)?
- Finance Students: Discover financial analysis techniques and apply them to real-world data.
- Academics: Utilize industry-specific models in your teaching or research projects.
- Investors: Evaluate your investment strategies and analyze the financial performance of United-Guardian, Inc. (UG).
- Analysts: Enhance your analysis process with a customizable financial model tailored for United-Guardian, Inc. (UG).
- Small Business Owners: Understand the analytical methods used for evaluating companies like United-Guardian, Inc. (UG).
What the Template Contains
- Pre-Filled DCF Model: United-Guardian, Inc.'s (UG) financial data preloaded for immediate use.
- WACC Calculator: Detailed calculations for Weighted Average Cost of Capital.
- Financial Ratios: Evaluate United-Guardian, Inc.'s (UG) profitability, leverage, and efficiency.
- Editable Inputs: Change assumptions such as growth, margins, and CAPEX to fit your scenarios.
- Financial Statements: Annual and quarterly reports to support detailed analysis.
- Interactive Dashboard: Easily visualize key valuation metrics and results.
Disclaimer
All information, articles, and product details provided on this website are for general informational and educational purposes only. We do not claim any ownership over, nor do we intend to infringe upon, any trademarks, copyrights, logos, brand names, or other intellectual property mentioned or depicted on this site. Such intellectual property remains the property of its respective owners, and any references here are made solely for identification or informational purposes, without implying any affiliation, endorsement, or partnership.
We make no representations or warranties, express or implied, regarding the accuracy, completeness, or suitability of any content or products presented. Nothing on this website should be construed as legal, tax, investment, financial, medical, or other professional advice. In addition, no part of this site—including articles or product references—constitutes a solicitation, recommendation, endorsement, advertisement, or offer to buy or sell any securities, franchises, or other financial instruments, particularly in jurisdictions where such activity would be unlawful.
All content is of a general nature and may not address the specific circumstances of any individual or entity. It is not a substitute for professional advice or services. Any actions you take based on the information provided here are strictly at your own risk. You accept full responsibility for any decisions or outcomes arising from your use of this website and agree to release us from any liability in connection with your use of, or reliance upon, the content or products found herein.