
|
Valoración DCF de Unilever PLC (UL) |
Completamente Editable: Adáptelo A Sus Necesidades En Excel O Sheets
Diseño Profesional: Plantillas Confiables Y Estándares De La Industria
Predeterminadas Para Un Uso Rápido Y Eficiente
Compatible con MAC / PC, completamente desbloqueado
No Se Necesita Experiencia; Fáciles De Seguir
Unilever PLC (UL) Bundle
¡Optimice su tiempo y aumente la precisión con nuestra calculadora DCF Unilever PLC (UL)! Equipado con datos reales de unilever y supuestos personalizables, esta herramienta le permite pronosticar, analizar y evaluar Unilever PLC (UL) como un inversor experimentado.
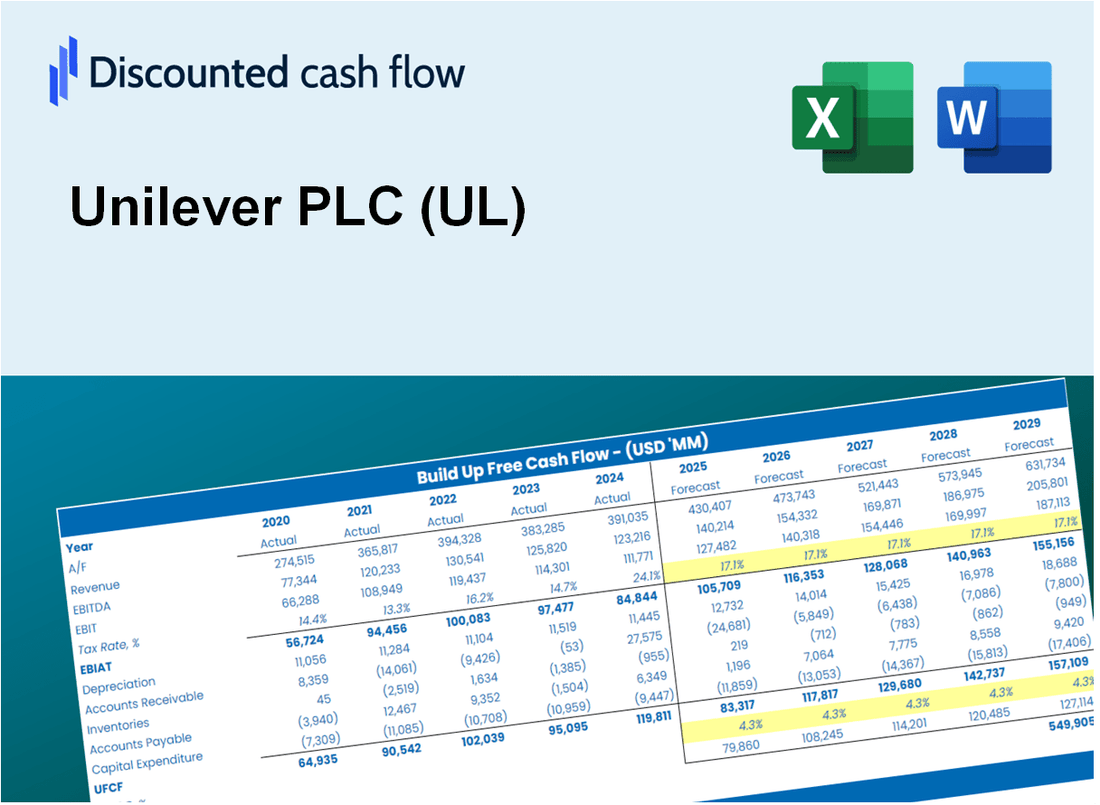
Discounted Cash Flow (DCF) - (USD MM)
| Year | AY1 2020 |
AY2 2021 |
AY3 2022 |
AY4 2023 |
AY5 2024 |
FY1 2025 |
FY2 2026 |
FY3 2027 |
FY4 2028 |
FY5 2029 |
|---|---|---|---|---|---|---|---|---|---|---|
| Revenue | 58,812.5 | 60,806.8 | 69,652.3 | 69,108.5 | 70,450.0 | 73,813.7 | 77,338.0 | 81,030.5 | 84,899.4 | 88,952.9 |
| Revenue Growth, % | 0 | 3.39 | 14.55 | -0.78072 | 1.94 | 4.77 | 4.77 | 4.77 | 4.77 | 4.77 |
| EBITDA | 13,190.0 | 13,198.1 | 12,412.0 | 12,821.3 | 15,081.1 | 15,044.9 | 15,763.3 | 16,515.9 | 17,304.5 | 18,130.7 |
| EBITDA, % | 22.43 | 21.71 | 17.82 | 18.55 | 21.41 | 20.38 | 20.38 | 20.38 | 20.38 | 20.38 |
| Depreciation | 2,339.8 | 2,024.4 | 1,239.5 | 1,147.9 | 2,037.2 | 2,013.6 | 2,109.7 | 2,210.5 | 2,316.0 | 2,426.6 |
| Depreciation, % | 3.98 | 3.33 | 1.78 | 1.66 | 2.89 | 2.73 | 2.73 | 2.73 | 2.73 | 2.73 |
| EBIT | 10,850.2 | 11,173.7 | 11,172.6 | 11,673.4 | 13,043.9 | 13,031.3 | 13,653.5 | 14,305.4 | 14,988.4 | 15,704.1 |
| EBIT, % | 18.45 | 18.38 | 16.04 | 16.89 | 18.52 | 17.65 | 17.65 | 17.65 | 17.65 | 17.65 |
| Total Cash | 7,301.1 | 5,211.8 | 6,403.7 | 7,083.1 | 8,845.5 | 7,821.9 | 8,195.4 | 8,586.7 | 8,996.6 | 9,426.2 |
| Total Cash, percent | .0 | .0 | .0 | .0 | .0 | .0 | .0 | .0 | .0 | .0 |
| Account Receivables | 3,980.4 | 5,182.8 | 5,268.6 | 5,725.4 | 5,933.0 | 5,840.4 | 6,119.2 | 6,411.4 | 6,717.5 | 7,038.3 |
| Account Receivables, % | 6.77 | 8.52 | 7.56 | 8.28 | 8.42 | 7.91 | 7.91 | 7.91 | 7.91 | 7.91 |
| Inventories | 5,173.5 | 5,429.8 | 6,876.8 | 5,935.3 | 6,002.5 | 6,600.1 | 6,915.2 | 7,245.4 | 7,591.3 | 7,953.8 |
| Inventories, % | 8.8 | 8.93 | 9.87 | 8.59 | 8.52 | 8.94 | 8.94 | 8.94 | 8.94 | 8.94 |
| Accounts Payable | 9,710.5 | 10,314.6 | 12,870.0 | 12,006.2 | 11,893.7 | 12,726.5 | 13,334.1 | 13,970.8 | 14,637.8 | 15,336.7 |
| Accounts Payable, % | 16.51 | 16.96 | 18.48 | 17.37 | 16.88 | 17.24 | 17.24 | 17.24 | 17.24 | 17.24 |
| Capital Expenditure | -1,000.6 | -1,284.7 | -1,688.2 | -1,741.5 | -2,015.1 | -1,715.2 | -1,797.1 | -1,882.9 | -1,972.7 | -2,066.9 |
| Capital Expenditure, % | -1.7 | -2.11 | -2.42 | -2.52 | -2.86 | -2.32 | -2.32 | -2.32 | -2.32 | -2.32 |
| Tax Rate, % | 35.24 | 35.24 | 35.24 | 35.24 | 35.24 | 35.24 | 35.24 | 35.24 | 35.24 | 35.24 |
| EBITAT | 7,573.2 | 7,899.7 | 8,259.7 | 8,108.5 | 8,447.9 | 9,086.8 | 9,520.6 | 9,975.2 | 10,451.5 | 10,950.5 |
| Depreciation | ||||||||||
| Changes in Account Receivables | ||||||||||
| Changes in Inventories | ||||||||||
| Changes in Accounts Payable | ||||||||||
| Capital Expenditure | ||||||||||
| UFCF | 9,468.9 | 7,784.9 | 8,833.7 | 7,135.8 | 8,082.7 | 9,713.0 | 9,847.0 | 10,317.1 | 10,809.7 | 11,325.9 |
| WACC, % | 4.44 | 4.45 | 4.47 | 4.44 | 4.4 | 4.44 | 4.44 | 4.44 | 4.44 | 4.44 |
| PV UFCF | ||||||||||
| SUM PV UFCF | 45,584.8 | |||||||||
| Long Term Growth Rate, % | 2.00 | |||||||||
| Free cash flow (T + 1) | 11,552 | |||||||||
| Terminal Value | 473,554 | |||||||||
| Present Terminal Value | 381,106 | |||||||||
| Enterprise Value | 426,691 | |||||||||
| Net Debt | 28,429 | |||||||||
| Equity Value | 398,262 | |||||||||
| Diluted Shares Outstanding, MM | 2,507 | |||||||||
| Equity Value Per Share | 158.85 |
What You Will Get
- Real Unilever Data: Preloaded financials – from revenue to EBIT – based on actual and projected figures.
- Full Customization: Adjust all critical parameters (yellow cells) like WACC, growth %, and tax rates.
- Instant Valuation Updates: Automatic recalculations to analyze the impact of changes on Unilever’s fair value.
- Versatile Excel Template: Tailored for quick edits, scenario testing, and detailed projections.
- Time-Saving and Accurate: Skip building models from scratch while maintaining precision and flexibility.
Key Features
- Comprehensive Historical Data: Unilever PLC’s (UL) past financial statements and pre-populated projections.
- Customizable Parameters: Modify WACC, tax rates, revenue growth, and EBITDA margins as needed.
- Real-Time Insights: Observe the recalculation of Unilever PLC’s (UL) intrinsic value instantly.
- Intuitive Visual Representations: Dashboard visuals present valuation outcomes and essential metrics.
- Designed for Precision: A robust tool tailored for analysts, investors, and finance professionals.
How It Works
- Download: Obtain the pre-formatted Excel file containing Unilever PLC’s (UL) financial data.
- Customize: Modify projections, such as sales growth, EBITDA margin, and discount rate.
- Update Automatically: The intrinsic value and NPV calculations refresh in real-time.
- Test Scenarios: Develop various forecasts and instantly compare the results.
- Make Decisions: Leverage the valuation insights to inform your investment approach.
Why Choose This Calculator for Unilever PLC (UL)?
- Accurate Data: Real Unilever financials ensure reliable valuation results.
- Customizable: Adjust key parameters like growth rates, WACC, and tax rates to align with your projections.
- Time-Saving: Pre-built calculations save you from starting from scratch.
- Professional-Grade Tool: Tailored for investors, analysts, and consultants.
- User-Friendly: Intuitive design and step-by-step guidance make it accessible for all users.
Who Should Use This Product?
- Investors: Accurately assess Unilever’s fair value before making investment choices.
- CFOs: Utilize a professional-grade DCF model for financial reporting and analysis.
- Consultants: Easily customize the template for client valuation reports.
- Entrepreneurs: Acquire insights into financial modeling practices of leading companies.
- Educators: Employ it as a teaching resource to illustrate valuation techniques.
What the Template Contains
- Historical Data: Includes Unilever’s past financials and baseline forecasts.
- DCF and Levered DCF Models: Detailed templates to calculate Unilever’s intrinsic value.
- WACC Sheet: Pre-built calculations for Weighted Average Cost of Capital.
- Editable Inputs: Modify key drivers like growth rates, EBITDA %, and CAPEX assumptions.
- Quarterly and Annual Statements: A complete breakdown of Unilever’s financials.
- Interactive Dashboard: Visualize valuation results and projections dynamically.
Disclaimer
All information, articles, and product details provided on this website are for general informational and educational purposes only. We do not claim any ownership over, nor do we intend to infringe upon, any trademarks, copyrights, logos, brand names, or other intellectual property mentioned or depicted on this site. Such intellectual property remains the property of its respective owners, and any references here are made solely for identification or informational purposes, without implying any affiliation, endorsement, or partnership.
We make no representations or warranties, express or implied, regarding the accuracy, completeness, or suitability of any content or products presented. Nothing on this website should be construed as legal, tax, investment, financial, medical, or other professional advice. In addition, no part of this site—including articles or product references—constitutes a solicitation, recommendation, endorsement, advertisement, or offer to buy or sell any securities, franchises, or other financial instruments, particularly in jurisdictions where such activity would be unlawful.
All content is of a general nature and may not address the specific circumstances of any individual or entity. It is not a substitute for professional advice or services. Any actions you take based on the information provided here are strictly at your own risk. You accept full responsibility for any decisions or outcomes arising from your use of this website and agree to release us from any liability in connection with your use of, or reliance upon, the content or products found herein.