
|
UNIBAIL-RODAMCO-WESTFIELD SE (URW.PA) Valoración de DCF |
Completamente Editable: Adáptelo A Sus Necesidades En Excel O Sheets
Diseño Profesional: Plantillas Confiables Y Estándares De La Industria
Predeterminadas Para Un Uso Rápido Y Eficiente
Compatible con MAC / PC, completamente desbloqueado
No Se Necesita Experiencia; Fáciles De Seguir
Unibail-Rodamco-Westfield SE (URW.PA) Bundle
¡Obtenga información sobre su análisis de valoración Unibail-Rodamco-Westfield SE (URWPA) utilizando nuestra calculadora DCF de vanguardia! Esta plantilla de Excel viene precargada con datos reales de URWPA, lo que le permite ajustar los pronósticos y los supuestos para determinar con precisión el valor intrínseco de Unibail-Rodamco-Westfield SE.
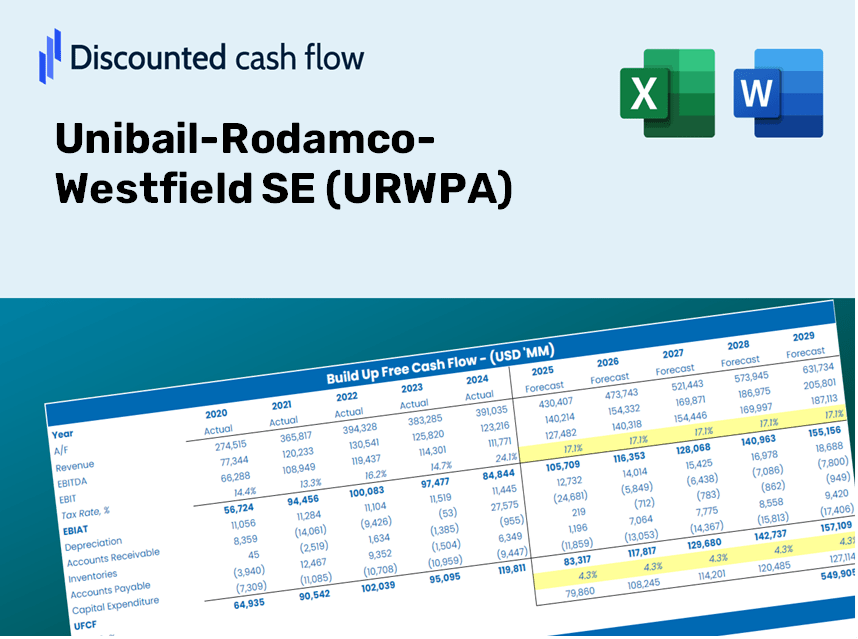
Discounted Cash Flow (DCF) - (USD MM)
| Year | AY1 2020 |
AY2 2021 |
AY3 2022 |
AY4 2023 |
AY5 2024 |
FY1 2025 |
FY2 2026 |
FY3 2027 |
FY4 2028 |
FY5 2029 |
|---|---|---|---|---|---|---|---|---|---|---|
| Revenue | 993.7 | 2,519.7 | 3,003.8 | 3,061.0 | 3,256.1 | 4,293.9 | 5,662.5 | 7,467.3 | 9,847.3 | 12,985.9 |
| Revenue Growth, % | 0 | 153.57 | 19.21 | 1.9 | 6.37 | 31.87 | 31.87 | 31.87 | 31.87 | 31.87 |
| EBITDA | -261.2 | 1,311.0 | 1,237.5 | 1,683.0 | 1,626.7 | 1,476.1 | 1,946.6 | 2,567.0 | 3,385.2 | 4,464.1 |
| EBITDA, % | -26.29 | 52.03 | 41.2 | 54.98 | 49.96 | 34.38 | 34.38 | 34.38 | 34.38 | 34.38 |
| Depreciation | 116.7 | 87.5 | 64.4 | 31.9 | 127.6 | 191.7 | 252.8 | 333.4 | 439.6 | 579.7 |
| Depreciation, % | 11.74 | 3.47 | 2.14 | 1.04 | 3.92 | 4.46 | 4.46 | 4.46 | 4.46 | 4.46 |
| EBIT | -377.9 | 1,223.5 | 1,173.1 | 1,651.1 | 1,499.1 | 1,284.4 | 1,693.8 | 2,233.6 | 2,945.5 | 3,884.4 |
| EBIT, % | -38.03 | 48.56 | 39.05 | 53.94 | 46.04 | 29.91 | 29.91 | 29.91 | 29.91 | 29.91 |
| Total Cash | 2,137.6 | 2,256.1 | 3,329.1 | 5,502.3 | 5,288.9 | 4,204.1 | 5,544.0 | 7,311.0 | 9,641.3 | 12,714.2 |
| Total Cash, percent | .0 | .0 | .0 | .0 | .0 | .0 | .0 | .0 | .0 | .0 |
| Account Receivables | 539.4 | 532.5 | 463.9 | 506.5 | 862.6 | 1,149.9 | 1,516.4 | 1,999.7 | 2,637.1 | 3,477.6 |
| Account Receivables, % | 54.28 | 21.13 | 15.44 | 16.55 | 26.49 | 26.78 | 26.78 | 26.78 | 26.78 | 26.78 |
| Inventories | 32.0 | 37.4 | 44.4 | 35.3 | 17.6 | 67.6 | 89.2 | 117.6 | 155.1 | 204.6 |
| Inventories, % | 3.22 | 1.48 | 1.48 | 1.15 | 0.54052 | 1.58 | 1.58 | 1.58 | 1.58 | 1.58 |
| Accounts Payable | 211.8 | 229.0 | 240.5 | 245.0 | 240.1 | 461.9 | 609.1 | 803.3 | 1,059.3 | 1,396.9 |
| Accounts Payable, % | 21.31 | 9.09 | 8.01 | 8 | 7.37 | 10.76 | 10.76 | 10.76 | 10.76 | 10.76 |
| Capital Expenditure | -1,164.3 | -888.9 | -904.8 | -1,181.0 | -1,308.3 | -2,096.8 | -2,765.1 | -3,646.4 | -4,808.7 | -6,341.3 |
| Capital Expenditure, % | -117.17 | -35.28 | -30.12 | -38.58 | -40.18 | -48.83 | -48.83 | -48.83 | -48.83 | -48.83 |
| Tax Rate, % | 62.61 | 62.61 | 62.61 | 62.61 | 62.61 | 62.61 | 62.61 | 62.61 | 62.61 | 62.61 |
| EBITAT | -342.6 | 1,161.4 | 595.2 | 1,518.6 | 560.5 | 939.4 | 1,238.8 | 1,633.6 | 2,154.3 | 2,840.9 |
| Depreciation | ||||||||||
| Changes in Account Receivables | ||||||||||
| Changes in Inventories | ||||||||||
| Changes in Accounts Payable | ||||||||||
| Capital Expenditure | ||||||||||
| UFCF | -1,749.8 | 378.7 | -172.1 | 340.5 | -963.5 | -1,081.3 | -1,514.4 | -1,997.1 | -2,633.6 | -3,473.0 |
| WACC, % | 5.84 | 5.96 | 4.75 | 5.88 | 4.38 | 5.36 | 5.36 | 5.36 | 5.36 | 5.36 |
| PV UFCF | ||||||||||
| SUM PV UFCF | -8,910.2 | |||||||||
| Long Term Growth Rate, % | 2.00 | |||||||||
| Free cash flow (T + 1) | -3,542 | |||||||||
| Terminal Value | -105,436 | |||||||||
| Present Terminal Value | -81,211 | |||||||||
| Enterprise Value | -90,121 | |||||||||
| Net Debt | 22,271 | |||||||||
| Equity Value | -112,392 | |||||||||
| Diluted Shares Outstanding, MM | 141 | |||||||||
| Equity Value Per Share | -796.39 |
What You Will Receive
- Authentic Unibail-Rodamco-Westfield Data: Comprehensive financials – encompassing revenue through EBIT – derived from actual and projected metrics.
- Complete Customization: Modify all essential variables (yellow cells) such as WACC, growth %, and tax rates to suit your analysis.
- Immediate Valuation Adjustments: Automatic recalculations enable you to evaluate the effects of changes on the fair value of Unibail-Rodamco-Westfield (URWPA).
- Flexible Excel Template: Designed for quick alterations, scenario analysis, and thorough forecasting.
- Efficient and Precise: Bypass the need to construct models from the ground up while ensuring both accuracy and adaptability.
Key Features
- Real-Time URWPA Data: Pre-loaded with Unibail-Rodamco-Westfield's historical financial information and future projections.
- Fully Customizable Parameters: Modify revenue growth, profit margins, WACC, tax rates, and capital expenditures to suit your analysis.
- Dynamic Valuation Engine: Instant updates to Net Present Value (NPV) and intrinsic value based on your adjustments.
- Scenario Analysis: Generate various forecast scenarios to evaluate different valuation results.
- User-Friendly Interface: Intuitive, organized, and crafted for both seasoned professionals and newcomers.
How It Works
- Download: Obtain the pre-prepared Excel file containing Unibail-Rodamco-Westfield SE’s (URWPA) financial data.
- Customize: Modify forecasts such as revenue growth, EBITDA %, and WACC according to your analysis.
- Update Automatically: Intrinsic value and NPV calculations refresh in real-time as you make changes.
- Test Scenarios: Generate various projections and instantly compare the results.
- Make Decisions: Leverage the valuation findings to inform your investment approach.
Why Opt for the URWPA Calculator?
- Precision: Based on real Unibail-Rodamco-Westfield SE (URWPA) financial data for reliable results.
- Versatility: Crafted to allow users to experiment and adjust inputs at their convenience.
- Efficiency: Eliminate the need to create a DCF model from the ground up.
- Expert-Level: Built with the accuracy and usability expected by CFOs.
- User-Friendly: Accessible for everyone, regardless of advanced financial modeling skills.
Who Can Benefit from This Product?
- Finance Students: Master valuation strategies and implement them with real-world data.
- Researchers: Utilize established models in your academic studies or publications.
- Investors: Validate your hypotheses and explore valuation results for Unibail-Rodamco-Westfield SE (URWPA).
- Financial Analysts: Enhance your efficiency with a ready-to-use, customizable DCF model.
- Small Business Entrepreneurs: Discover how major public firms like Unibail-Rodamco-Westfield SE (URWPA) are evaluated.
Contents of the Template
- Pre-Filled Data: Contains historical financials and forecasts for Unibail-Rodamco-Westfield SE (URWPA).
- Discounted Cash Flow Model: An editable DCF valuation model with automatic calculations included.
- Weighted Average Cost of Capital (WACC): A specific sheet for calculating WACC tailored to your custom inputs.
- Key Financial Ratios: Evaluate Unibail-Rodamco-Westfield's profitability, efficiency, and leverage.
- Customizable Inputs: Easily modify revenue growth, margins, and tax rates as needed.
- Clear Dashboard: Visual representations and tables that summarize essential valuation results.
Disclaimer
All information, articles, and product details provided on this website are for general informational and educational purposes only. We do not claim any ownership over, nor do we intend to infringe upon, any trademarks, copyrights, logos, brand names, or other intellectual property mentioned or depicted on this site. Such intellectual property remains the property of its respective owners, and any references here are made solely for identification or informational purposes, without implying any affiliation, endorsement, or partnership.
We make no representations or warranties, express or implied, regarding the accuracy, completeness, or suitability of any content or products presented. Nothing on this website should be construed as legal, tax, investment, financial, medical, or other professional advice. In addition, no part of this site—including articles or product references—constitutes a solicitation, recommendation, endorsement, advertisement, or offer to buy or sell any securities, franchises, or other financial instruments, particularly in jurisdictions where such activity would be unlawful.
All content is of a general nature and may not address the specific circumstances of any individual or entity. It is not a substitute for professional advice or services. Any actions you take based on the information provided here are strictly at your own risk. You accept full responsibility for any decisions or outcomes arising from your use of this website and agree to release us from any liability in connection with your use of, or reliance upon, the content or products found herein.