
|
Valoración DCF de Universal Stainless & Alloy Products, Inc. (USAP) |
Completamente Editable: Adáptelo A Sus Necesidades En Excel O Sheets
Diseño Profesional: Plantillas Confiables Y Estándares De La Industria
Predeterminadas Para Un Uso Rápido Y Eficiente
Compatible con MAC / PC, completamente desbloqueado
No Se Necesita Experiencia; Fáciles De Seguir
Universal Stainless & Alloy Products, Inc. (USAP) Bundle
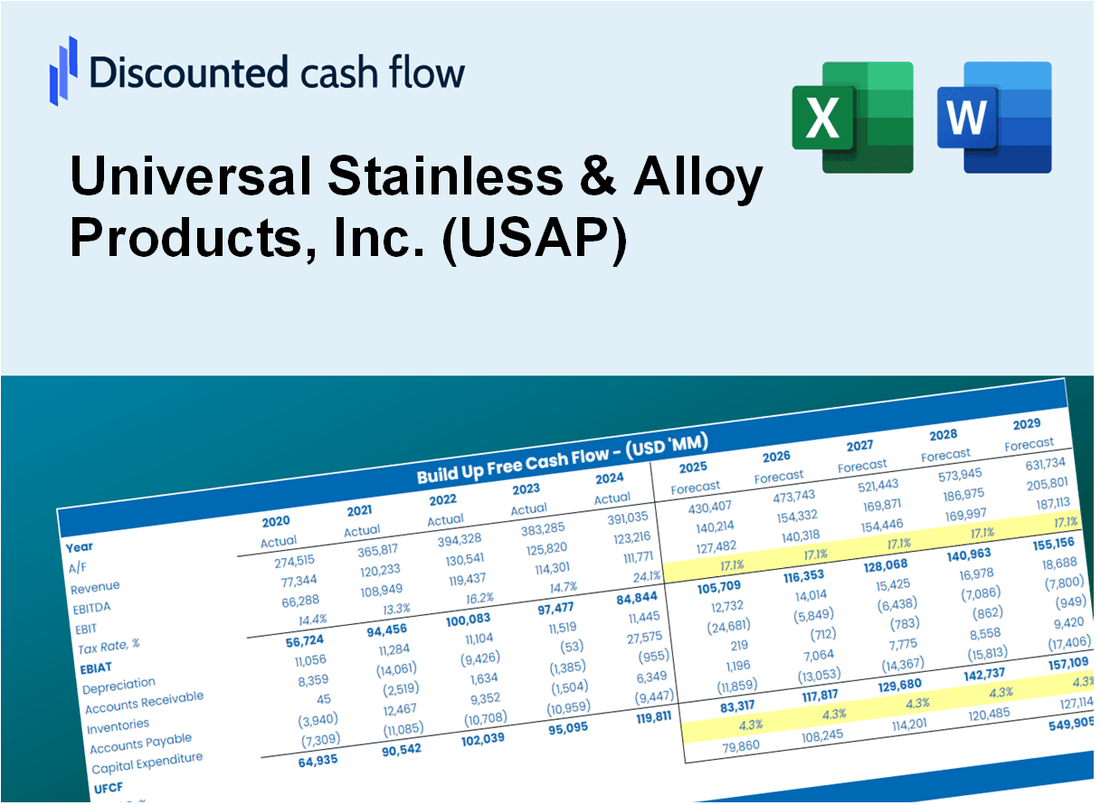
Ya sea que sea un inversor o analista, esta calculadora DCF (USAP) es su herramienta final para una valoración precisa. Precargados con datos reales de un inoxidable universal & Alloy Products, Inc., puede ajustar las previsiones y ver instantáneamente los efectos.
What You Will Receive
- Customizable Excel Template: A fully adaptable Excel-based DCF Calculator featuring pre-filled real USAP financials.
- Authentic Data: Historical figures and forward-looking projections (as indicated in the highlighted cells).
- Assumption Flexibility: Adjust forecast parameters such as revenue growth, EBITDA %, and WACC.
- Instant Calculations: Quickly observe how your inputs affect Universal Stainless & Alloy Products, Inc.'s valuation.
- Professional Resource: Designed for investors, CFOs, consultants, and financial analysts.
- Intuitive Layout: Organized for clarity and simplicity, complete with step-by-step guidance.
Key Features
- Real-Life USAP Data: Pre-filled with Universal Stainless & Alloy Products, Inc.'s historical financials and forward-looking projections.
- Fully Customizable Inputs: Adjust revenue growth, margins, WACC, tax rates, and capital expenditures as needed.
- Dynamic Valuation Model: Automatic updates to Net Present Value (NPV) and intrinsic value based on your inputs.
- Scenario Testing: Create multiple forecast scenarios to evaluate different valuation outcomes.
- User-Friendly Design: Intuitive, structured interface suitable for both professionals and beginners.
How It Works
- Download: Obtain the comprehensive Excel file featuring Universal Stainless & Alloy Products, Inc.'s (USAP) financial data.
- Customize: Modify projections, including revenue growth, EBITDA %, and WACC.
- Update Automatically: The intrinsic value and NPV calculations refresh in real-time.
- Test Scenarios: Develop various forecasts and instantly compare the results.
- Make Decisions: Leverage the valuation outcomes to inform your investment choices.
Why Choose Universal Stainless & Alloy Products, Inc. (USAP)?
- Quality Assurance: Our products meet the highest industry standards for stainless and alloy materials.
- Expertise in the Field: Decades of experience ensure reliable solutions tailored to your needs.
- Wide Product Range: A comprehensive selection of stainless and alloy products to suit various applications.
- Customer-Centric Approach: We prioritize your requirements and provide personalized support throughout the process.
- Industry Recognition: Trusted by leading manufacturers for our commitment to excellence and innovation.
Who Should Use This Product?
- Individual Investors: Gain insights to make informed decisions about investing in Universal Stainless & Alloy Products, Inc. (USAP).
- Financial Analysts: Enhance valuation processes with comprehensive financial models tailored for USAP.
- Consultants: Provide clients with accurate and timely valuation analyses of USAP.
- Business Owners: Learn about the valuation of companies like Universal Stainless to inform your own business strategies.
- Finance Students: Explore valuation methodologies using real data and case studies related to USAP.
What the Template Contains
- Pre-Filled DCF Model: Universal Stainless & Alloy Products, Inc. (USAP) financial data preloaded for immediate use.
- WACC Calculator: Detailed calculations for Weighted Average Cost of Capital.
- Financial Ratios: Evaluate Universal Stainless & Alloy Products, Inc. (USAP) profitability, leverage, and efficiency.
- Editable Inputs: Change assumptions such as growth, margins, and CAPEX to fit your scenarios.
- Financial Statements: Annual and quarterly reports to support detailed analysis.
- Interactive Dashboard: Easily visualize key valuation metrics and results.
Disclaimer
All information, articles, and product details provided on this website are for general informational and educational purposes only. We do not claim any ownership over, nor do we intend to infringe upon, any trademarks, copyrights, logos, brand names, or other intellectual property mentioned or depicted on this site. Such intellectual property remains the property of its respective owners, and any references here are made solely for identification or informational purposes, without implying any affiliation, endorsement, or partnership.
We make no representations or warranties, express or implied, regarding the accuracy, completeness, or suitability of any content or products presented. Nothing on this website should be construed as legal, tax, investment, financial, medical, or other professional advice. In addition, no part of this site—including articles or product references—constitutes a solicitation, recommendation, endorsement, advertisement, or offer to buy or sell any securities, franchises, or other financial instruments, particularly in jurisdictions where such activity would be unlawful.
All content is of a general nature and may not address the specific circumstances of any individual or entity. It is not a substitute for professional advice or services. Any actions you take based on the information provided here are strictly at your own risk. You accept full responsibility for any decisions or outcomes arising from your use of this website and agree to release us from any liability in connection with your use of, or reliance upon, the content or products found herein.