
|
Valoración DCF de U.S. Bancorp (USB) |
Completamente Editable: Adáptelo A Sus Necesidades En Excel O Sheets
Diseño Profesional: Plantillas Confiables Y Estándares De La Industria
Predeterminadas Para Un Uso Rápido Y Eficiente
Compatible con MAC / PC, completamente desbloqueado
No Se Necesita Experiencia; Fáciles De Seguir
U.S. Bancorp (USB) Bundle
Ingementista para su precisión, nuestra calculadora DCF de EE. UU. Bancorp (USB) le permite evaluar la valoración de Bancorp de EE. UU. Usando datos financieros reales, ofreciendo una flexibilidad completa para modificar todos los parámetros esenciales para las proyecciones mejoradas.
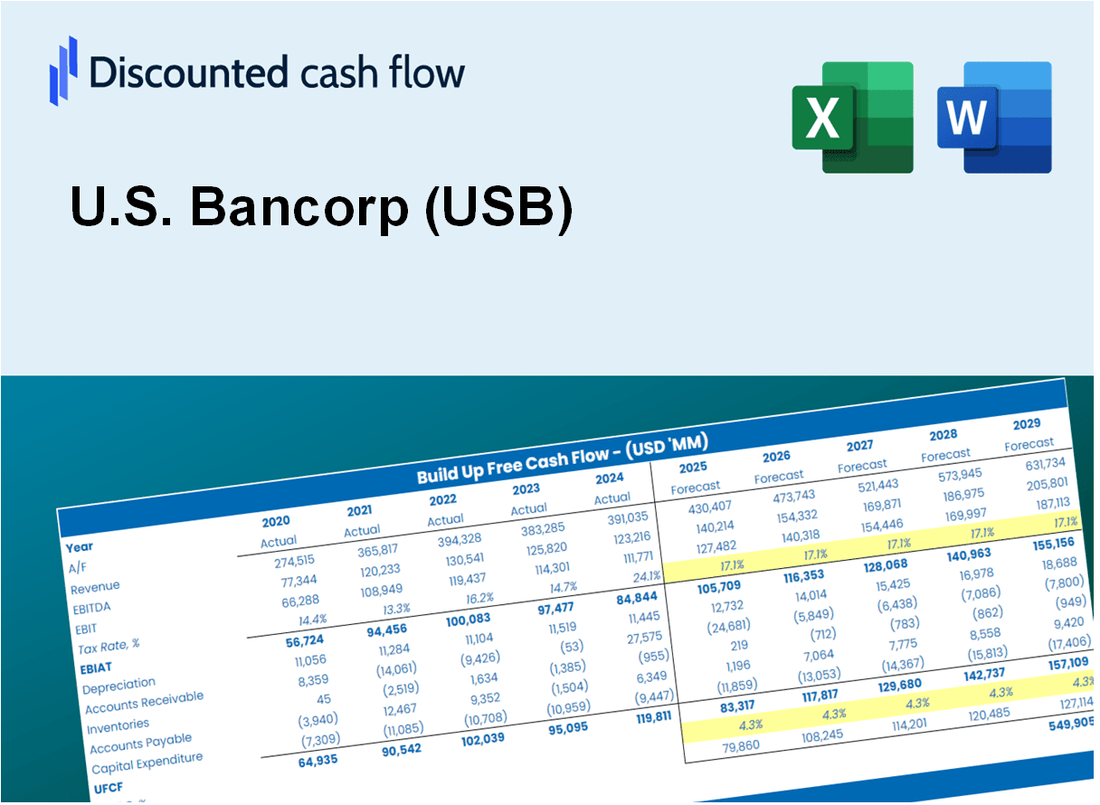
Discounted Cash Flow (DCF) - (USD MM)
| Year | AY1 2020 |
AY2 2021 |
AY3 2022 |
AY4 2023 |
AY5 2024 |
FY1 2025 |
FY2 2026 |
FY3 2027 |
FY4 2028 |
FY5 2029 |
|---|---|---|---|---|---|---|---|---|---|---|
| Revenue | 25,241.0 | 23,714.0 | 27,401.0 | 40,624.0 | 42,712.0 | 49,428.0 | 57,199.9 | 66,193.9 | 76,602.1 | 88,646.9 |
| Revenue Growth, % | 0 | -6.05 | 15.55 | 48.26 | 5.14 | 15.72 | 15.72 | 15.72 | 15.72 | 15.72 |
| EBITDA | 6,578.0 | 10,663.0 | 7,861.0 | 7,883.0 | 8,848.0 | 13,823.5 | 15,997.1 | 18,512.4 | 21,423.3 | 24,791.8 |
| EBITDA, % | 26.06 | 44.96 | 28.69 | 19.4 | 20.72 | 27.97 | 27.97 | 27.97 | 27.97 | 27.97 |
| Depreciation | 527.0 | 497.0 | 560.0 | 1,018.0 | 939.0 | 1,080.7 | 1,250.6 | 1,447.2 | 1,674.8 | 1,938.1 |
| Depreciation, % | 2.09 | 2.1 | 2.04 | 2.51 | 2.2 | 2.19 | 2.19 | 2.19 | 2.19 | 2.19 |
| EBIT | 6,051.0 | 10,166.0 | 7,301.0 | 6,865.0 | 7,909.0 | 12,742.8 | 14,746.5 | 17,065.2 | 19,748.5 | 22,853.7 |
| EBIT, % | 23.97 | 42.87 | 26.65 | 16.9 | 18.52 | 25.78 | 25.78 | 25.78 | 25.78 | 25.78 |
| Total Cash | 199,018.0 | 161,311.0 | 125,594.0 | 130,560.0 | 142,866.0 | 49,428.0 | 57,199.9 | 66,193.9 | 76,602.1 | 88,646.9 |
| Total Cash, percent | .0 | .0 | .0 | .0 | .0 | .0 | .0 | .0 | .0 | .0 |
| Account Receivables | 13,706.0 | 12,367.0 | 10,081.0 | 8,340.0 | 8,270.0 | 18,103.9 | 20,950.5 | 24,244.7 | 28,056.9 | 32,468.5 |
| Account Receivables, % | 54.3 | 52.15 | 36.79 | 20.53 | 19.36 | 36.63 | 36.63 | 36.63 | 36.63 | 36.63 |
| Inventories | .0 | .0 | .0 | .0 | .0 | .0 | .0 | .0 | .0 | .0 |
| Inventories, % | 0 | 0 | 0 | 0 | 0 | 0 | 0 | 0 | 0 | 0 |
| Accounts Payable | .0 | .0 | .0 | .0 | .0 | .0 | .0 | .0 | .0 | .0 |
| Accounts Payable, % | 0 | 0 | 0 | 0 | 0 | 0 | 0 | 0 | 0 | 0 |
| Capital Expenditure | .0 | .0 | .0 | .0 | .0 | .0 | .0 | .0 | .0 | .0 |
| Capital Expenditure, % | 0 | 0 | 0 | 0 | 0 | 0 | 0 | 0 | 0 | 0 |
| Tax Rate, % | 20.36 | 20.36 | 20.36 | 20.36 | 20.36 | 20.36 | 20.36 | 20.36 | 20.36 | 20.36 |
| EBITAT | 4,959.0 | 7,963.0 | 5,825.0 | 5,429.0 | 6,299.0 | 10,163.5 | 11,761.6 | 13,610.9 | 15,751.1 | 18,227.8 |
| Depreciation | ||||||||||
| Changes in Account Receivables | ||||||||||
| Changes in Inventories | ||||||||||
| Changes in Accounts Payable | ||||||||||
| Capital Expenditure | ||||||||||
| UFCF | -8,220.0 | 9,799.0 | 8,671.0 | 8,188.0 | 7,308.0 | 1,410.3 | 10,165.5 | 11,764.0 | 13,613.7 | 15,754.3 |
| WACC, % | 12.97 | 12.58 | 12.74 | 12.66 | 12.72 | 12.74 | 12.74 | 12.74 | 12.74 | 12.74 |
| PV UFCF | ||||||||||
| SUM PV UFCF | 34,539.2 | |||||||||
| Long Term Growth Rate, % | 2.00 | |||||||||
| Free cash flow (T + 1) | 16,069 | |||||||||
| Terminal Value | 149,677 | |||||||||
| Present Terminal Value | 82,194 | |||||||||
| Enterprise Value | 116,733 | |||||||||
| Net Debt | 17,018 | |||||||||
| Equity Value | 99,715 | |||||||||
| Diluted Shares Outstanding, MM | 1,561 | |||||||||
| Equity Value Per Share | 63.88 |
What You Will Get
- Real USB Financials: Access historical and forecasted data for precise valuation.
- Customizable Inputs: Adjust WACC, tax rates, revenue growth, and capital expenditures as needed.
- Dynamic Calculations: Intrinsic value and NPV are computed automatically.
- Scenario Analysis: Evaluate various scenarios to assess U.S. Bancorp’s future performance.
- User-Friendly Design: Designed for professionals while remaining approachable for beginners.
Key Features
- Real-Life USB Data: Pre-filled with U.S. Bancorp’s historical financials and forward-looking projections.
- Fully Customizable Inputs: Adjust revenue growth, margins, WACC, tax rates, and capital expenditures.
- Dynamic Valuation Model: Automatic updates to Net Present Value (NPV) and intrinsic value based on your inputs.
- Scenario Testing: Create multiple forecast scenarios to analyze different valuation outcomes.
- User-Friendly Design: Simple, structured, and designed for professionals and beginners alike.
How It Works
- Step 1: Download the prebuilt Excel template featuring U.S. Bancorp’s (USB) data.
- Step 2: Navigate through the pre-filled sheets to grasp the essential metrics.
- Step 3: Modify forecasts and assumptions in the editable yellow cells (WACC, growth, margins).
- Step 4: Instantly see recalculated results, including U.S. Bancorp’s (USB) intrinsic value.
- Step 5: Make informed investment decisions or create reports based on the outputs.
Why Choose U.S. Bancorp (USB)?
- Save Time: Quickly access essential banking services without the hassle of lengthy processes.
- Enhance Financial Security: Robust systems and protocols ensure your financial data is protected.
- Fully Customizable Services: Tailor banking solutions to meet your unique financial needs.
- User-Friendly Experience: Intuitive interfaces and clear information make banking straightforward.
- Endorsed by Industry Leaders: Trusted by financial professionals for our commitment to excellence.
Who Should Use This Product?
- Investors: Accurately assess U.S. Bancorp's (USB) fair value prior to making investment choices.
- CFOs: Utilize a professional-grade DCF model for financial reporting and analysis related to U.S. Bancorp (USB).
- Consultants: Easily customize the template for valuation reports tailored to clients interested in U.S. Bancorp (USB).
- Entrepreneurs: Acquire insights into the financial modeling techniques employed by major banking institutions like U.S. Bancorp (USB).
- Educators: Employ it as a teaching resource to illustrate valuation methodologies specific to U.S. Bancorp (USB).
What the Template Contains
- Operating and Balance Sheet Data: Pre-filled U.S. Bancorp historical data and forecasts, including revenue, EBITDA, EBIT, and capital expenditures.
- WACC Calculation: A dedicated sheet for Weighted Average Cost of Capital (WACC), including parameters like Beta, risk-free rate, and share price.
- DCF Valuation (Unlevered and Levered): Editable Discounted Cash Flow models showing intrinsic value with detailed calculations.
- Financial Statements: Pre-loaded financial statements (annual and quarterly) to support analysis.
- Key Ratios: Includes profitability, leverage, and efficiency ratios for U.S. Bancorp (USB).
- Dashboard and Charts: Visual summary of valuation outputs and assumptions to analyze results easily.
Disclaimer
All information, articles, and product details provided on this website are for general informational and educational purposes only. We do not claim any ownership over, nor do we intend to infringe upon, any trademarks, copyrights, logos, brand names, or other intellectual property mentioned or depicted on this site. Such intellectual property remains the property of its respective owners, and any references here are made solely for identification or informational purposes, without implying any affiliation, endorsement, or partnership.
We make no representations or warranties, express or implied, regarding the accuracy, completeness, or suitability of any content or products presented. Nothing on this website should be construed as legal, tax, investment, financial, medical, or other professional advice. In addition, no part of this site—including articles or product references—constitutes a solicitation, recommendation, endorsement, advertisement, or offer to buy or sell any securities, franchises, or other financial instruments, particularly in jurisdictions where such activity would be unlawful.
All content is of a general nature and may not address the specific circumstances of any individual or entity. It is not a substitute for professional advice or services. Any actions you take based on the information provided here are strictly at your own risk. You accept full responsibility for any decisions or outcomes arising from your use of this website and agree to release us from any liability in connection with your use of, or reliance upon, the content or products found herein.