
|
Valoración de DCF de la Corporación Celular de los Estados Unidos (USE) |
Completamente Editable: Adáptelo A Sus Necesidades En Excel O Sheets
Diseño Profesional: Plantillas Confiables Y Estándares De La Industria
Predeterminadas Para Un Uso Rápido Y Eficiente
Compatible con MAC / PC, completamente desbloqueado
No Se Necesita Experiencia; Fáciles De Seguir
United States Cellular Corporat (UZE) Bundle
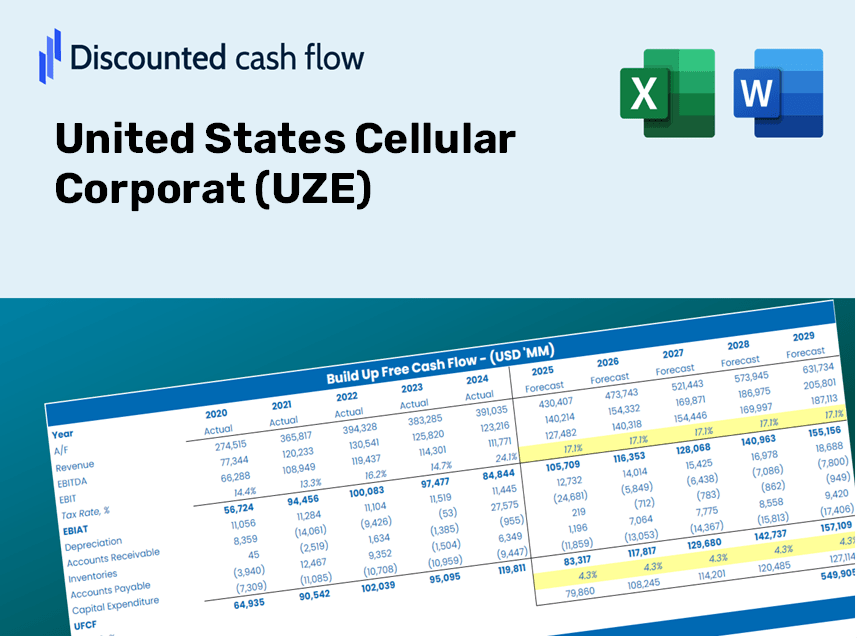
¡Explore el futuro financiero de la Corporación Celular de los Estados Unidos (UZE) con nuestra calculadora DCF fácil de usar! Ingrese sus suposiciones con respecto al crecimiento, los márgenes y los costos para calcular el valor intrínseco de la Corporación Celular de los Estados Unidos (UZE) y mejorar su estrategia de inversión.
Discounted Cash Flow (DCF) - (USD MM)
| Year | AY1 2020 |
AY2 2021 |
AY3 2022 |
AY4 2023 |
AY5 2024 |
FY1 2025 |
FY2 2026 |
FY3 2027 |
FY4 2028 |
FY5 2029 |
|---|---|---|---|---|---|---|---|---|---|---|
| Revenue | 4,037.0 | 4,122.0 | 4,169.0 | 3,906.0 | 3,770.0 | 3,708.3 | 3,647.6 | 3,588.0 | 3,529.3 | 3,471.5 |
| Revenue Growth, % | 0 | 2.11 | 1.14 | -6.31 | -3.48 | -1.64 | -1.64 | -1.64 | -1.64 | -1.64 |
| EBITDA | 876.0 | 1,033.0 | 935.0 | 963.0 | 826.0 | 858.5 | 844.4 | 830.6 | 817.0 | 803.7 |
| EBITDA, % | 21.7 | 25.06 | 22.43 | 24.65 | 21.91 | 23.15 | 23.15 | 23.15 | 23.15 | 23.15 |
| Depreciation | 683.0 | 678.0 | 700.0 | 656.0 | 665.0 | 627.4 | 617.1 | 607.0 | 597.1 | 587.3 |
| Depreciation, % | 16.92 | 16.45 | 16.79 | 16.79 | 17.64 | 16.92 | 16.92 | 16.92 | 16.92 | 16.92 |
| EBIT | 193.0 | 355.0 | 235.0 | 307.0 | 161.0 | 231.1 | 227.3 | 223.6 | 219.9 | 216.3 |
| EBIT, % | 4.78 | 8.61 | 5.64 | 7.86 | 4.27 | 6.23 | 6.23 | 6.23 | 6.23 | 6.23 |
| Total Cash | 1,274.0 | 156.0 | 273.0 | 150.0 | 144.0 | 367.5 | 361.5 | 355.6 | 349.8 | 344.0 |
| Total Cash, percent | .0 | .0 | .0 | .0 | .0 | .0 | .0 | .0 | .0 | .0 |
| Account Receivables | 928.0 | 1,169.0 | 1,076.0 | 958.0 | 955.0 | 942.0 | 926.6 | 911.4 | 896.5 | 881.9 |
| Account Receivables, % | 22.99 | 28.36 | 25.81 | 24.53 | 25.33 | 25.4 | 25.4 | 25.4 | 25.4 | 25.4 |
| Inventories | 146.0 | 173.0 | 261.0 | 199.0 | 179.0 | 177.4 | 174.5 | 171.6 | 168.8 | 166.1 |
| Inventories, % | 3.62 | 4.2 | 6.26 | 5.09 | 4.75 | 4.78 | 4.78 | 4.78 | 4.78 | 4.78 |
| Accounts Payable | 387.0 | 346.0 | 344.0 | 241.0 | 232.0 | 286.0 | 281.3 | 276.7 | 272.1 | 267.7 |
| Accounts Payable, % | 9.59 | 8.39 | 8.25 | 6.17 | 6.15 | 7.71 | 7.71 | 7.71 | 7.71 | 7.71 |
| Capital Expenditure | -989.0 | -2,046.0 | -1,187.0 | -738.0 | -557.0 | -1,010.7 | -994.2 | -977.9 | -961.9 | -946.2 |
| Capital Expenditure, % | -24.5 | -49.64 | -28.47 | -18.89 | -14.77 | -27.26 | -27.26 | -27.26 | -27.26 | -27.26 |
| Tax Rate, % | -77.27 | -77.27 | -77.27 | -77.27 | -77.27 | -77.27 | -77.27 | -77.27 | -77.27 | -77.27 |
| EBITAT | 176.8 | 305.7 | 97.9 | 149.4 | 285.4 | 170.1 | 167.3 | 164.6 | 161.9 | 159.2 |
| Depreciation | ||||||||||
| Changes in Account Receivables | ||||||||||
| Changes in Inventories | ||||||||||
| Changes in Accounts Payable | ||||||||||
| Capital Expenditure | ||||||||||
| UFCF | -816.2 | -1,371.3 | -386.1 | 144.4 | 407.4 | -144.7 | -196.1 | -192.9 | -189.7 | -186.6 |
| WACC, % | 4.54 | 4.41 | 3.36 | 3.53 | 4.74 | 4.11 | 4.11 | 4.11 | 4.11 | 4.11 |
| PV UFCF | ||||||||||
| SUM PV UFCF | -804.8 | |||||||||
| Long Term Growth Rate, % | 2.00 | |||||||||
| Free cash flow (T + 1) | -190 | |||||||||
| Terminal Value | -9,007 | |||||||||
| Present Terminal Value | -7,363 | |||||||||
| Enterprise Value | -8,168 | |||||||||
| Net Debt | 3,678 | |||||||||
| Equity Value | -11,846 | |||||||||
| Diluted Shares Outstanding, MM | 86 | |||||||||
| Equity Value Per Share | -137.74 |
Benefits You Will Receive
- Pre-Filled Financial Model: Leverage United States Cellular Corporation's actual data for accurate DCF valuation.
- Comprehensive Forecast Control: Modify revenue growth, margins, WACC, and other essential parameters.
- Real-Time Calculations: Enjoy automatic updates that show results instantly as you make adjustments.
- Investor-Ready Template: A polished Excel file crafted for high-quality valuation presentations.
- Customizable and Reusable: Designed for adaptability, allowing you to perform in-depth forecasts repeatedly.
Key Features
- Customizable Forecast Inputs: Adjust essential parameters such as revenue growth, EBITDA margins, and capital expenditures with ease.
- Instant DCF Valuation: Automatically computes intrinsic value, NPV, and other key metrics in real time.
- High-Precision Accuracy: Leverages United States Cellular Corporation's (UZE) actual financial data for reliable valuation insights.
- Simplified Scenario Analysis: Effortlessly evaluate various assumptions and assess their impacts side by side.
- Efficiency Booster: Remove the complexity of constructing valuation models from the ground up.
How It Works
- Step 1: Download the ready-made Excel template featuring United States Cellular Corporation's (UZE) data.
- Step 2: Review the pre-populated sheets to familiarize yourself with the key performance indicators.
- Step 3: Modify forecasts and assumptions in the edit-friendly yellow cells (WACC, growth, margins).
- Step 4: Immediately see the updated results, including the intrinsic value of United States Cellular Corporation (UZE).
- Step 5: Utilize the results to make educated investment choices or create detailed reports.
Why Use the United States Cellular Corporation (UZE) Calculator?
- Time-Saving: Eliminate the hassle of building a DCF model from scratch – it’s pre-built and ready to go.
- Enhanced Accuracy: Dependable financial data and calculations minimize valuation errors.
- Completely Customizable: Adjust the model to match your specific assumptions and forecasts.
- User-Friendly: Intuitive charts and outputs simplify the analysis of results.
- Endorsed by Professionals: Crafted for experts who prioritize both precision and ease of use.
Who Should Utilize This Product?
- Investors: Accurately assess the fair value of United States Cellular Corporation (UZE) before making investment choices.
- CFOs: Utilize a professional-grade DCF model for financial reporting and analysis specific to UZE.
- Consultants: Efficiently customize the template for valuation reports tailored to UZE clients.
- Entrepreneurs: Discover financial modeling insights used by leading companies like UZE.
- Educators: Employ it as a teaching resource to illustrate valuation methodologies related to UZE.
Contents of the Template
- Operating and Balance Sheet Data: Pre-filled United States Cellular Corporation (UZE) historical data and forecasts, including revenue, EBITDA, EBIT, and capital expenditures.
- WACC Calculation: A dedicated sheet for Weighted Average Cost of Capital (WACC), featuring parameters such as Beta, risk-free rate, and share price.
- DCF Valuation (Unlevered and Levered): Customizable Discounted Cash Flow models that present intrinsic value along with detailed calculations.
- Financial Statements: Pre-loaded financial statements (annual and quarterly) to facilitate thorough analysis.
- Key Ratios: Includes profitability, leverage, and efficiency ratios specific to United States Cellular Corporation (UZE).
- Dashboard and Charts: A visual summary of valuation outputs and assumptions to simplify result analysis.
Disclaimer
All information, articles, and product details provided on this website are for general informational and educational purposes only. We do not claim any ownership over, nor do we intend to infringe upon, any trademarks, copyrights, logos, brand names, or other intellectual property mentioned or depicted on this site. Such intellectual property remains the property of its respective owners, and any references here are made solely for identification or informational purposes, without implying any affiliation, endorsement, or partnership.
We make no representations or warranties, express or implied, regarding the accuracy, completeness, or suitability of any content or products presented. Nothing on this website should be construed as legal, tax, investment, financial, medical, or other professional advice. In addition, no part of this site—including articles or product references—constitutes a solicitation, recommendation, endorsement, advertisement, or offer to buy or sell any securities, franchises, or other financial instruments, particularly in jurisdictions where such activity would be unlawful.
All content is of a general nature and may not address the specific circumstances of any individual or entity. It is not a substitute for professional advice or services. Any actions you take based on the information provided here are strictly at your own risk. You accept full responsibility for any decisions or outcomes arising from your use of this website and agree to release us from any liability in connection with your use of, or reliance upon, the content or products found herein.