
|
Varroc Engineering Limited (Varroc.NS) Valoración de DCF |
Completamente Editable: Adáptelo A Sus Necesidades En Excel O Sheets
Diseño Profesional: Plantillas Confiables Y Estándares De La Industria
Predeterminadas Para Un Uso Rápido Y Eficiente
Compatible con MAC / PC, completamente desbloqueado
No Se Necesita Experiencia; Fáciles De Seguir
Varroc Engineering Limited (VARROC.NS) Bundle
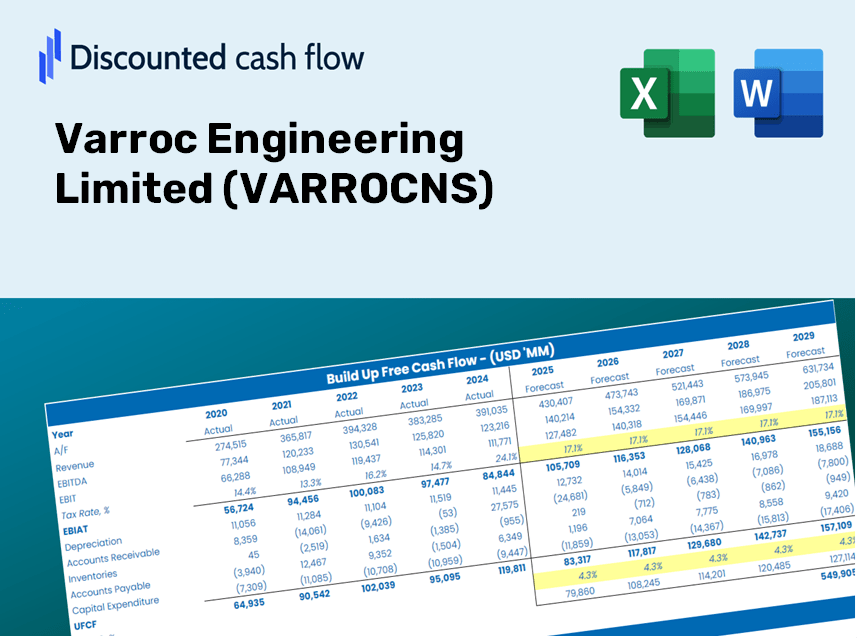
¡Simplifique la valoración limitada de Varroc Engineering con esta calculadora DCF personalizable! Con el Real Varroc Engineering Limited Financials y las entradas de pronóstico ajustables, puede probar escenarios y descubrir el valor razonable de Varroc Engineering Limited en minutos.
Discounted Cash Flow (DCF) - (USD MM)
| Year | AY1 2021 |
AY2 2022 |
AY3 2023 |
AY4 2024 |
AY5 2025 |
FY1 2026 |
FY2 2027 |
FY3 2028 |
FY4 2029 |
FY5 2030 |
|---|---|---|---|---|---|---|---|---|---|---|
| Revenue | 43,738.8 | 58,442.0 | 68,912.1 | 75,519.4 | 81,540.8 | 95,625.5 | 112,143.1 | 131,513.8 | 154,230.4 | 180,870.9 |
| Revenue Growth, % | 0 | 33.62 | 17.92 | 9.59 | 7.97 | 17.27 | 17.27 | 17.27 | 17.27 | 17.27 |
| EBITDA | 6,277.0 | 6,833.6 | 5,417.3 | 7,024.8 | 7,261.9 | 9,966.7 | 11,688.2 | 13,707.2 | 16,074.8 | 18,851.5 |
| EBITDA, % | 14.35 | 11.69 | 7.86 | 9.3 | 8.91 | 10.42 | 10.42 | 10.42 | 10.42 | 10.42 |
| Depreciation | 5,262.1 | 5,889.5 | 2,818.9 | 2,803.0 | 2,727.9 | 6,360.2 | 7,458.8 | 8,747.2 | 10,258.1 | 12,030.0 |
| Depreciation, % | 12.03 | 10.08 | 4.09 | 3.71 | 3.35 | 6.65 | 6.65 | 6.65 | 6.65 | 6.65 |
| EBIT | 1,014.9 | 944.1 | 2,598.5 | 4,221.8 | 4,534.0 | 3,606.5 | 4,229.4 | 4,960.0 | 5,816.7 | 6,821.4 |
| EBIT, % | 2.32 | 1.62 | 3.77 | 5.59 | 5.56 | 3.77 | 3.77 | 3.77 | 3.77 | 3.77 |
| Total Cash | 7,452.3 | 1,178.7 | 3,571.5 | 2,266.1 | 2,007.7 | 5,680.3 | 6,661.5 | 7,812.1 | 9,161.5 | 10,744.0 |
| Total Cash, percent | .0 | .0 | .0 | .0 | .0 | .0 | .0 | .0 | .0 | .0 |
| Account Receivables | 19,207.3 | 5,740.6 | 6,322.4 | 5,071.4 | 6,797.7 | 14,910.5 | 17,486.0 | 20,506.4 | 24,048.5 | 28,202.4 |
| Account Receivables, % | 43.91 | 9.82 | 9.17 | 6.72 | 8.34 | 15.59 | 15.59 | 15.59 | 15.59 | 15.59 |
| Inventories | 12,564.6 | 6,155.9 | 6,710.0 | 6,744.4 | 7,327.6 | 12,797.4 | 15,007.9 | 17,600.2 | 20,640.3 | 24,205.6 |
| Inventories, % | 28.73 | 10.53 | 9.74 | 8.93 | 8.99 | 13.38 | 13.38 | 13.38 | 13.38 | 13.38 |
| Accounts Payable | 30,311.6 | 9,781.1 | 11,873.9 | 12,084.6 | 13,925.2 | 26,076.7 | 30,580.9 | 35,863.2 | 42,058.0 | 49,322.7 |
| Accounts Payable, % | 69.3 | 16.74 | 17.23 | 16 | 17.08 | 27.27 | 27.27 | 27.27 | 27.27 | 27.27 |
| Capital Expenditure | -7,751.5 | -8,535.2 | -5,981.6 | -2,742.5 | -2,888.9 | -9,214.7 | -10,806.4 | -12,673.0 | -14,862.0 | -17,429.1 |
| Capital Expenditure, % | -17.72 | -14.6 | -8.68 | -3.63 | -3.54 | -9.64 | -9.64 | -9.64 | -9.64 | -9.64 |
| Tax Rate, % | 63.82 | 63.82 | 63.82 | 63.82 | 63.82 | 63.82 | 63.82 | 63.82 | 63.82 | 63.82 |
| EBITAT | -5,064.4 | 34,858.2 | -25,709.8 | 7,053.2 | 1,640.2 | 1,703.5 | 1,997.8 | 2,342.8 | 2,747.5 | 3,222.1 |
| Depreciation | ||||||||||
| Changes in Account Receivables | ||||||||||
| Changes in Inventories | ||||||||||
| Changes in Accounts Payable | ||||||||||
| Capital Expenditure | ||||||||||
| UFCF | -9,013.9 | 31,557.3 | -27,915.7 | 8,541.1 | 1,010.2 | -2,582.0 | -1,631.5 | -1,913.4 | -2,243.8 | -2,631.4 |
| WACC, % | 4.43 | 5.98 | 4.43 | 5.98 | 4.99 | 5.16 | 5.16 | 5.16 | 5.16 | 5.16 |
| PV UFCF | ||||||||||
| SUM PV UFCF | -9,456.0 | |||||||||
| Long Term Growth Rate, % | 4.00 | |||||||||
| Free cash flow (T + 1) | -2,737 | |||||||||
| Terminal Value | -235,253 | |||||||||
| Present Terminal Value | -182,900 | |||||||||
| Enterprise Value | -192,356 | |||||||||
| Net Debt | 10,070 | |||||||||
| Equity Value | -202,426 | |||||||||
| Diluted Shares Outstanding, MM | 153 | |||||||||
| Equity Value Per Share | -1,324.90 |
What You Will Receive
- Genuine Varroc Data: Pre-loaded financial metrics – from revenue to EBIT – based on real and projected figures.
- Comprehensive Customization: Modify all essential parameters (yellow cells) such as WACC, growth %, and tax rates.
- Instant Valuation Adjustments: Automatic recalculations to evaluate the influence of changes on Varroc Engineering's fair value.
- Flexible Excel Template: Designed for quick modifications, scenario analysis, and thorough projections.
- Efficient and Precise: Avoid building models from scratch while ensuring accuracy and adaptability.
Key Features
- Pre-Loaded Data: Varroc Engineering Limited’s historical financial statements and pre-filled forecasts.
- Fully Adjustable Inputs: Customize WACC, tax rates, revenue growth, and EBITDA margins as needed.
- Instant Results: View Varroc Engineering Limited’s intrinsic value updating in real time.
- Clear Visual Outputs: Dashboard charts illustrate valuation outcomes and essential metrics.
- Built for Accuracy: A professional resource tailored for analysts, investors, and finance professionals.
How It Works
- Step 1: Download the Excel file.
- Step 2: Examine the pre-filled Varroc Engineering Limited (VARROCNS) data, including historical and projected figures.
- Step 3: Modify the key assumptions (highlighted in yellow) according to your analysis.
- Step 4: Observe the automatic recalculations of Varroc Engineering's intrinsic value.
- Step 5: Utilize the results for your investment decisions or reporting needs.
Why Opt for This Calculator?
- Precise Data: Utilize actual Varroc Engineering Limited financials for trustworthy valuation outcomes.
- Flexible: Modify essential parameters such as growth rates, WACC, and tax rates to align with your forecasts.
- Efficient: Built-in calculations save you the hassle of starting from the beginning.
- Professional Quality: Created with the needs of investors, analysts, and consultants in mind.
- Easy to Use: A clear layout and guided instructions make it accessible for users of all experience levels.
Who Can Benefit from This Product?
- Professional Investors: Develop comprehensive and reliable valuation models for portfolio assessments.
- Corporate Finance Teams: Evaluate valuation scenarios to inform internal strategies.
- Consultants and Advisors: Offer clients precise valuation insights for Varroc Engineering Limited (VARROCNS) stock.
- Students and Educators: Utilize real-world data for hands-on practice and instruction in financial modeling.
- Automotive Enthusiasts: Gain insights into how automotive companies like Varroc Engineering Limited (VARROCNS) are valued in the market.
Contents of the Template
- Pre-Filled Data: Contains Varroc Engineering Limited's historical financials and future projections.
- Discounted Cash Flow Model: Adjustable DCF valuation model featuring automatic calculations.
- Weighted Average Cost of Capital (WACC): A specialized sheet for computing WACC using customized inputs.
- Key Financial Ratios: Evaluate Varroc's profitability, operational efficiency, and financial leverage.
- Customizable Inputs: Easily modify revenue growth rates, profit margins, and tax expenses.
- Clear Dashboard: Visual representations and tables summarizing essential valuation outcomes.
Disclaimer
All information, articles, and product details provided on this website are for general informational and educational purposes only. We do not claim any ownership over, nor do we intend to infringe upon, any trademarks, copyrights, logos, brand names, or other intellectual property mentioned or depicted on this site. Such intellectual property remains the property of its respective owners, and any references here are made solely for identification or informational purposes, without implying any affiliation, endorsement, or partnership.
We make no representations or warranties, express or implied, regarding the accuracy, completeness, or suitability of any content or products presented. Nothing on this website should be construed as legal, tax, investment, financial, medical, or other professional advice. In addition, no part of this site—including articles or product references—constitutes a solicitation, recommendation, endorsement, advertisement, or offer to buy or sell any securities, franchises, or other financial instruments, particularly in jurisdictions where such activity would be unlawful.
All content is of a general nature and may not address the specific circumstances of any individual or entity. It is not a substitute for professional advice or services. Any actions you take based on the information provided here are strictly at your own risk. You accept full responsibility for any decisions or outcomes arising from your use of this website and agree to release us from any liability in connection with your use of, or reliance upon, the content or products found herein.