
|
Valoración DCF de INNOVATE Corp. (VATE) |
Completamente Editable: Adáptelo A Sus Necesidades En Excel O Sheets
Diseño Profesional: Plantillas Confiables Y Estándares De La Industria
Predeterminadas Para Un Uso Rápido Y Eficiente
Compatible con MAC / PC, completamente desbloqueado
No Se Necesita Experiencia; Fáciles De Seguir
INNOVATE Corp. (VATE) Bundle
¿Busca evaluar el valor intrínseco de Innovate Corp.? Nuestra calculadora DCF (Vate) integra datos del mundo real con extensas características de personalización, lo que le permite ajustar los pronósticos y mejorar sus opciones de inversión.
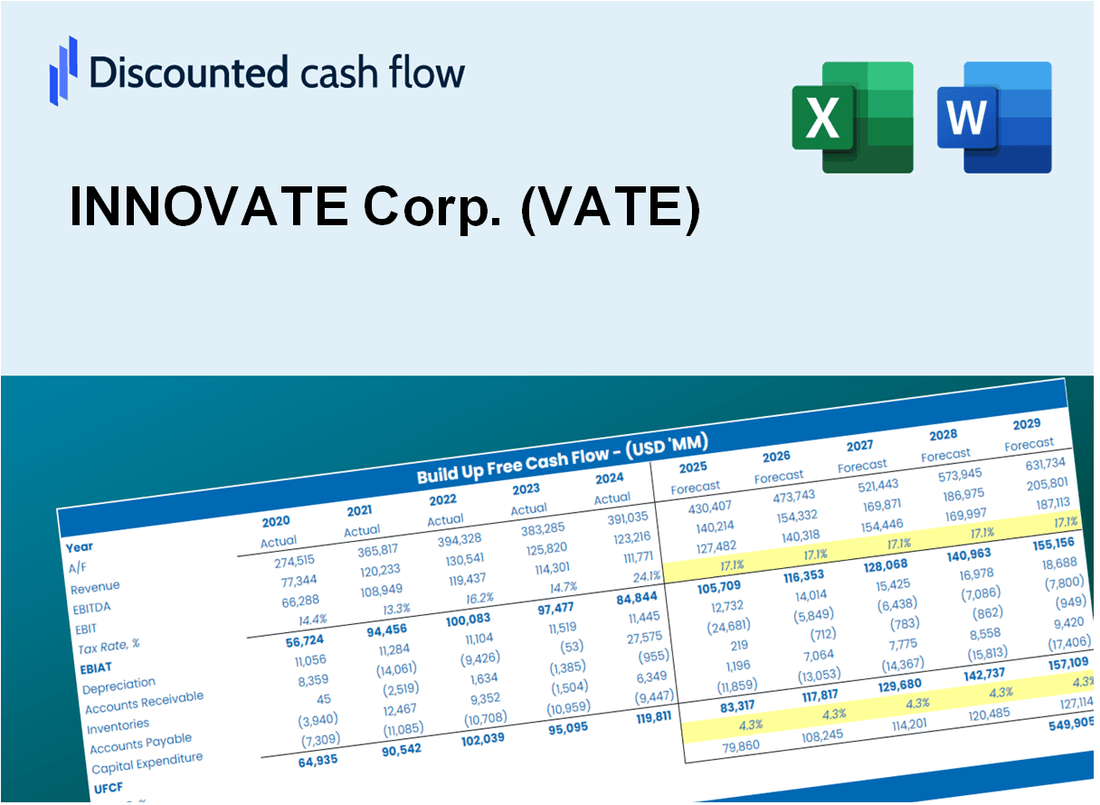
Discounted Cash Flow (DCF) - (USD MM)
| Year | AY1 2020 |
AY2 2021 |
AY3 2022 |
AY4 2023 |
AY5 2024 |
FY1 2025 |
FY2 2026 |
FY3 2027 |
FY4 2028 |
FY5 2029 |
|---|---|---|---|---|---|---|---|---|---|---|
| Revenue | 1,005.8 | 1,205.2 | 1,637.3 | 1,423.0 | 1,107.1 | 1,249.1 | 1,409.3 | 1,590.0 | 1,793.9 | 2,023.9 |
| Revenue Growth, % | 0 | 19.83 | 35.85 | -13.09 | -22.2 | 12.82 | 12.82 | 12.82 | 12.82 | 12.82 |
| EBITDA | 54.9 | 31.8 | 62.8 | 63.1 | 72.9 | 57.3 | 64.7 | 73.0 | 82.3 | 92.9 |
| EBITDA, % | 5.46 | 2.64 | 3.84 | 4.43 | 6.58 | 4.59 | 4.59 | 4.59 | 4.59 | 4.59 |
| Depreciation | 26.8 | 37.6 | 42.2 | 36.0 | 32.9 | 34.6 | 39.1 | 44.1 | 49.7 | 56.1 |
| Depreciation, % | 2.66 | 3.12 | 2.58 | 2.53 | 2.97 | 2.77 | 2.77 | 2.77 | 2.77 | 2.77 |
| EBIT | 28.1 | -5.8 | 20.6 | 27.1 | 40.0 | 22.7 | 25.6 | 28.9 | 32.6 | 36.8 |
| EBIT, % | 2.79 | -0.48125 | 1.26 | 1.9 | 3.61 | 1.82 | 1.82 | 1.82 | 1.82 | 1.82 |
| Total Cash | 4,688.4 | 45.5 | 80.4 | 80.8 | 48.8 | 296.7 | 334.8 | 377.7 | 426.1 | 480.8 |
| Total Cash, percent | .0 | .0 | .0 | .0 | .0 | .0 | .0 | .0 | .0 | .0 |
| Account Receivables | 221.3 | 365.7 | 420.0 | 399.1 | 300.9 | 332.8 | 375.5 | 423.6 | 478.0 | 539.3 |
| Account Receivables, % | 22 | 30.34 | 25.65 | 28.05 | 27.18 | 26.64 | 26.64 | 26.64 | 26.64 | 26.64 |
| Inventories | 9.9 | 17.0 | 18.9 | 22.4 | 20.8 | 17.5 | 19.7 | 22.3 | 25.1 | 28.3 |
| Inventories, % | 0.98429 | 1.41 | 1.15 | 1.57 | 1.88 | 1.4 | 1.4 | 1.4 | 1.4 | 1.4 |
| Accounts Payable | 69.7 | 179.2 | 202.5 | 142.9 | 84.8 | 129.6 | 146.2 | 164.9 | 186.1 | 210.0 |
| Accounts Payable, % | 6.93 | 14.87 | 12.37 | 10.04 | 7.66 | 10.37 | 10.37 | 10.37 | 10.37 | 10.37 |
| Capital Expenditure | -17.8 | -24.1 | -20.7 | -18.4 | -19.0 | -20.1 | -22.7 | -25.6 | -28.9 | -32.6 |
| Capital Expenditure, % | -1.77 | -2 | -1.26 | -1.29 | -1.72 | -1.61 | -1.61 | -1.61 | -1.61 | -1.61 |
| Tax Rate, % | -3.59 | -3.59 | -3.59 | -3.59 | -3.59 | -3.59 | -3.59 | -3.59 | -3.59 | -3.59 |
| EBITAT | 46.9 | -16.4 | 18.0 | 27.7 | 41.4 | 22.1 | 25.0 | 28.2 | 31.8 | 35.9 |
| Depreciation | ||||||||||
| Changes in Account Receivables | ||||||||||
| Changes in Inventories | ||||||||||
| Changes in Accounts Payable | ||||||||||
| Capital Expenditure | ||||||||||
| UFCF | -105.6 | -44.9 | 6.6 | 3.1 | 97.0 | 52.8 | 13.1 | 14.7 | 16.6 | 18.8 |
| WACC, % | 4.38 | 4.38 | 3.95 | 4.38 | 4.38 | 4.29 | 4.29 | 4.29 | 4.29 | 4.29 |
| PV UFCF | ||||||||||
| SUM PV UFCF | 104.9 | |||||||||
| Long Term Growth Rate, % | 2.00 | |||||||||
| Free cash flow (T + 1) | 19 | |||||||||
| Terminal Value | 834 | |||||||||
| Present Terminal Value | 676 | |||||||||
| Enterprise Value | 781 | |||||||||
| Net Debt | 670 | |||||||||
| Equity Value | 111 | |||||||||
| Diluted Shares Outstanding, MM | 13 | |||||||||
| Equity Value Per Share | 8.45 |
What You Will Receive
- Flexible Forecast Inputs: Modify key assumptions (growth %, profit margins, discount rates) to explore various scenarios.
- Industry-Specific Data: INNOVATE Corp.'s financial metrics pre-loaded to facilitate your analysis.
- Automated Valuation Outputs: The template computes Net Present Value (NPV) and intrinsic value automatically.
- Tailored and Professional Design: A sophisticated Excel model that meets your valuation requirements.
- Designed for Analysts and Investors: Perfect for evaluating projections, confirming strategies, and enhancing efficiency.
Key Features
- Comprehensive Financial Data: Gain access to precise historical figures and future estimates for INNOVATE Corp. (VATE).
- Personalized Forecast Parameters: Modify highlighted fields such as WACC, growth rates, and profit margins to suit your analysis.
- Automated Calculations: Enjoy real-time updates for DCF, Net Present Value (NPV), and cash flow assessments.
- User-Friendly Dashboard: Intuitive charts and summaries to effectively present your valuation findings.
- Designed for All Skill Levels: An accessible and straightforward layout tailored for investors, CFOs, and consultants alike.
How It Works
- Step 1: Download the Excel file.
- Step 2: Review INNOVATE Corp.'s (VATE) pre-filled financial data and forecasts.
- Step 3: Modify key inputs such as revenue growth, WACC, and tax rates (highlighted cells).
- Step 4: Observe the DCF model update in real-time as you adjust assumptions.
- Step 5: Evaluate the outputs and leverage the results for informed investment decisions.
Why Choose INNOVATE Corp. (VATE)?
- All-in-One Solution: Offers a comprehensive suite of tools for financial modeling and analysis.
- Flexible Parameters: Modify highlighted fields to explore different financial scenarios.
- In-Depth Analysis: Automatically computes INNOVATE Corp.'s intrinsic value and Net Present Value.
- Rich Data Set: Comes with historical and projected data for reliable analysis.
- Expert-Level Resource: Perfect for financial professionals, investors, and business advisors.
Who Should Use INNOVATE Corp. (VATE)?
- Professional Investors: Develop comprehensive and accurate valuation models for investment analysis.
- Corporate Finance Teams: Evaluate valuation scenarios to inform strategic decision-making.
- Consultants and Advisors: Deliver precise valuation insights for clients interested in INNOVATE Corp. (VATE).
- Students and Educators: Utilize real-world data to enhance learning and teaching in financial modeling.
- Tech Enthusiasts: Gain insights into how innovative companies like INNOVATE Corp. (VATE) are valued in the marketplace.
What the Template Contains
- Preloaded VATE Data: Historical and projected financial data, including revenue, EBIT, and capital expenditures.
- DCF and WACC Models: Professional-grade sheets for calculating intrinsic value and Weighted Average Cost of Capital.
- Editable Inputs: Yellow-highlighted cells for adjusting revenue growth, tax rates, and discount rates.
- Financial Statements: Comprehensive annual and quarterly financials for deeper analysis.
- Key Ratios: Profitability, leverage, and efficiency ratios to evaluate performance.
- Dashboard and Charts: Visual summaries of valuation outcomes and assumptions.
Disclaimer
All information, articles, and product details provided on this website are for general informational and educational purposes only. We do not claim any ownership over, nor do we intend to infringe upon, any trademarks, copyrights, logos, brand names, or other intellectual property mentioned or depicted on this site. Such intellectual property remains the property of its respective owners, and any references here are made solely for identification or informational purposes, without implying any affiliation, endorsement, or partnership.
We make no representations or warranties, express or implied, regarding the accuracy, completeness, or suitability of any content or products presented. Nothing on this website should be construed as legal, tax, investment, financial, medical, or other professional advice. In addition, no part of this site—including articles or product references—constitutes a solicitation, recommendation, endorsement, advertisement, or offer to buy or sell any securities, franchises, or other financial instruments, particularly in jurisdictions where such activity would be unlawful.
All content is of a general nature and may not address the specific circumstances of any individual or entity. It is not a substitute for professional advice or services. Any actions you take based on the information provided here are strictly at your own risk. You accept full responsibility for any decisions or outcomes arising from your use of this website and agree to release us from any liability in connection with your use of, or reliance upon, the content or products found herein.