
|
Varun Beverages Limited (VBL.NS) DCF Valoración |
Completamente Editable: Adáptelo A Sus Necesidades En Excel O Sheets
Diseño Profesional: Plantillas Confiables Y Estándares De La Industria
Predeterminadas Para Un Uso Rápido Y Eficiente
Compatible con MAC / PC, completamente desbloqueado
No Se Necesita Experiencia; Fáciles De Seguir
Varun Beverages Limited (VBL.NS) Bundle
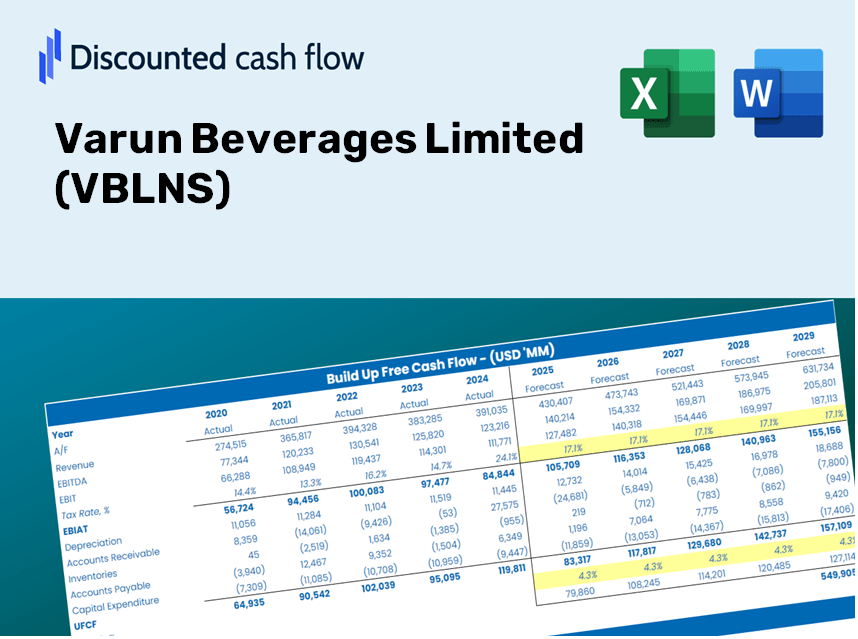
Ya sea que sea un inversionista o analista, esta calculadora DCF de Varun Beverages Limited (VBLNS) es su recurso de referencia para una valoración precisa. Precedidos con datos reales de Varun Beverages Limited, puede ajustar los pronósticos y observar instantáneamente los efectos.
Discounted Cash Flow (DCF) - (USD MM)
| Year | AY1 2020 |
AY2 2021 |
AY3 2022 |
AY4 2023 |
AY5 2024 |
FY1 2025 |
FY2 2026 |
FY3 2027 |
FY4 2028 |
FY5 2029 |
|---|---|---|---|---|---|---|---|---|---|---|
| Revenue | 64,501.4 | 88,232.3 | 131,731.4 | 160,425.8 | 200,076.5 | 266,397.0 | 354,701.2 | 472,276.1 | 628,824.2 | 837,264.2 |
| Revenue Growth, % | 0 | 36.79 | 49.3 | 21.78 | 24.72 | 33.15 | 33.15 | 33.15 | 33.15 | 33.15 |
| EBITDA | 12,109.7 | 16,616.6 | 28,268.9 | 37,467.4 | 48,312.4 | 56,779.1 | 75,600.0 | 100,659.5 | 134,025.7 | 178,452.0 |
| EBITDA, % | 18.77 | 18.83 | 21.46 | 23.35 | 24.15 | 21.31 | 21.31 | 21.31 | 21.31 | 21.31 |
| Depreciation | 5,054.5 | 5,065.7 | 5,388.3 | 6,440.7 | 8,633.5 | 13,851.4 | 18,442.8 | 24,556.2 | 32,696.0 | 43,533.9 |
| Depreciation, % | 7.84 | 5.74 | 4.09 | 4.01 | 4.32 | 5.2 | 5.2 | 5.2 | 5.2 | 5.2 |
| EBIT | 7,055.2 | 11,550.9 | 22,880.6 | 31,026.7 | 39,679.0 | 42,927.6 | 57,157.1 | 76,103.3 | 101,329.7 | 134,918.1 |
| EBIT, % | 10.94 | 13.09 | 17.37 | 19.34 | 19.83 | 16.11 | 16.11 | 16.11 | 16.11 | 16.11 |
| Total Cash | 1,045.6 | 1,507.5 | 2,851.8 | 4,598.6 | 24,499.2 | 10,978.7 | 14,617.9 | 19,463.3 | 25,915.0 | 34,505.2 |
| Total Cash, percent | .0 | .0 | .0 | .0 | .0 | .0 | .0 | .0 | .0 | .0 |
| Account Receivables | 4,249.4 | 4,668.0 | 6,864.0 | 10,702.6 | 16,544.6 | 17,065.3 | 22,722.0 | 30,253.8 | 40,282.2 | 53,634.7 |
| Account Receivables, % | 6.59 | 5.29 | 5.21 | 6.67 | 8.27 | 6.41 | 6.41 | 6.41 | 6.41 | 6.41 |
| Inventories | 9,288.0 | 14,480.9 | 19,938.9 | 21,505.3 | 27,912.3 | 39,055.9 | 52,002.0 | 69,239.4 | 92,190.6 | 122,749.5 |
| Inventories, % | 14.4 | 16.41 | 15.14 | 13.41 | 13.95 | 14.66 | 14.66 | 14.66 | 14.66 | 14.66 |
| Accounts Payable | 5,113.9 | 7,117.5 | 8,242.6 | 7,582.5 | 15,604.3 | 18,529.4 | 24,671.5 | 32,849.5 | 43,738.3 | 58,236.5 |
| Accounts Payable, % | 7.93 | 8.07 | 6.26 | 4.73 | 7.8 | 6.96 | 6.96 | 6.96 | 6.96 | 6.96 |
| Capital Expenditure | -5,596.7 | -9,422.4 | -18,009.9 | -32,640.5 | -37,790.1 | -38,500.6 | -51,262.6 | -68,255.0 | -90,879.8 | -121,004.3 |
| Capital Expenditure, % | -8.68 | -10.68 | -13.67 | -20.35 | -18.89 | -14.45 | -14.45 | -14.45 | -14.45 | -14.45 |
| Tax Rate, % | 24.42 | 24.42 | 24.42 | 24.42 | 24.42 | 24.42 | 24.42 | 24.42 | 24.42 | 24.42 |
| EBITAT | 6,403.0 | 7,964.3 | 16,931.0 | 23,285.9 | 29,988.3 | 32,996.9 | 43,934.5 | 58,497.8 | 77,888.3 | 103,706.4 |
| Depreciation | ||||||||||
| Changes in Account Receivables | ||||||||||
| Changes in Inventories | ||||||||||
| Changes in Accounts Payable | ||||||||||
| Capital Expenditure | ||||||||||
| UFCF | -2,562.8 | -.3 | -2,219.4 | -8,979.1 | -3,395.6 | -391.4 | -1,346.0 | -1,792.2 | -2,386.3 | -3,177.3 |
| WACC, % | 4.88 | 4.81 | 4.83 | 4.83 | 4.84 | 4.84 | 4.84 | 4.84 | 4.84 | 4.84 |
| PV UFCF | ||||||||||
| SUM PV UFCF | -7,637.2 | |||||||||
| Long Term Growth Rate, % | 4.00 | |||||||||
| Free cash flow (T + 1) | -3,304 | |||||||||
| Terminal Value | -393,791 | |||||||||
| Present Terminal Value | -310,920 | |||||||||
| Enterprise Value | -318,557 | |||||||||
| Net Debt | 5,600 | |||||||||
| Equity Value | -324,157 | |||||||||
| Diluted Shares Outstanding, MM | 3,266 | |||||||||
| Equity Value Per Share | -99.26 |
What You Will Receive
- Authentic Varun Beverages Data: Preloaded financial information – from revenue to EBIT – based on real and projected metrics.
- Complete Customization: Modify all essential parameters (yellow cells) such as WACC, growth %, and tax rates.
- Instant Valuation Updates: Automatic recalculations to assess the effect of changes on Varun Beverages' fair value.
- Flexible Excel Template: Designed for quick modifications, scenario analysis, and detailed forecasts.
- Efficient and Precise: Eliminate the need to build models from the ground up while ensuring accuracy and adaptability.
Core Highlights
- Authentic Varun Financials: Gain access to reliable pre-loaded historical data and future forecasts for Varun Beverages Limited (VBLNS).
- Adjustable Forecast Parameters: Modify yellow-highlighted cells such as WACC, growth rates, and profit margins.
- Real-Time Calculations: Enjoy automatic updates to DCF, Net Present Value (NPV), and cash flow metrics.
- Interactive Dashboard: Utilize user-friendly charts and summaries for clear visualization of your valuation outcomes.
- Designed for All Levels: A straightforward, intuitive layout tailored for investors, CFOs, and consultants alike.
How It Works
- Step 1: Download the prebuilt Excel template featuring Varun Beverages Limited’s (VBLNS) data.
- Step 2: Navigate through the pre-filled sheets to grasp the essential metrics.
- Step 3: Modify forecasts and assumptions in the editable yellow cells (WACC, growth, margins).
- Step 4: Immediately observe the recalculated results, including Varun Beverages Limited’s intrinsic value.
- Step 5: Make well-informed investment decisions or produce reports based on the outputs.
Why Opt for This Calculator?
- All-in-One Solution: Features DCF, WACC, and financial ratio assessments in a single package.
- Tailored Inputs: Modify the yellow-highlighted fields to explore different scenarios.
- In-Depth Analysis: Automatically computes Varun Beverages Limited’s intrinsic value and Net Present Value.
- Preloaded Information: Historical and projected data provide reliable starting points.
- Professional Standard: Perfect for financial analysts, investors, and business consultants.
Who Should Use This Product?
- Individual Investors: Make informed choices about purchasing or selling Varun Beverages Limited (VBLNS) stock.
- Financial Analysts: Enhance valuation methodologies with ready-to-use financial models tailored for Varun Beverages Limited (VBLNS).
- Consultants: Provide clients with professional valuation insights focused on Varun Beverages Limited (VBLNS) quickly and accurately.
- Business Owners: Gain insights into how companies like Varun Beverages Limited (VBLNS) are valued to inform your own business strategies.
- Finance Students: Explore valuation techniques using real-world data and scenarios related to Varun Beverages Limited (VBLNS).
Overview of the Template Components
- Pre-Filled DCF Model: Varun Beverages Limited’s (VBLNS) financial data preloaded for immediate utilization.
- WACC Calculator: Comprehensive calculations for Weighted Average Cost of Capital.
- Financial Ratios: Assess Varun Beverages Limited’s profitability, leverage, and efficiency metrics.
- Editable Inputs: Modify assumptions such as growth rates, profit margins, and CAPEX to align with your scenarios.
- Financial Statements: Access annual and quarterly reports for in-depth analysis.
- Interactive Dashboard: Effortlessly visualize key valuation metrics and outcomes.
Disclaimer
All information, articles, and product details provided on this website are for general informational and educational purposes only. We do not claim any ownership over, nor do we intend to infringe upon, any trademarks, copyrights, logos, brand names, or other intellectual property mentioned or depicted on this site. Such intellectual property remains the property of its respective owners, and any references here are made solely for identification or informational purposes, without implying any affiliation, endorsement, or partnership.
We make no representations or warranties, express or implied, regarding the accuracy, completeness, or suitability of any content or products presented. Nothing on this website should be construed as legal, tax, investment, financial, medical, or other professional advice. In addition, no part of this site—including articles or product references—constitutes a solicitation, recommendation, endorsement, advertisement, or offer to buy or sell any securities, franchises, or other financial instruments, particularly in jurisdictions where such activity would be unlawful.
All content is of a general nature and may not address the specific circumstances of any individual or entity. It is not a substitute for professional advice or services. Any actions you take based on the information provided here are strictly at your own risk. You accept full responsibility for any decisions or outcomes arising from your use of this website and agree to release us from any liability in connection with your use of, or reliance upon, the content or products found herein.