
|
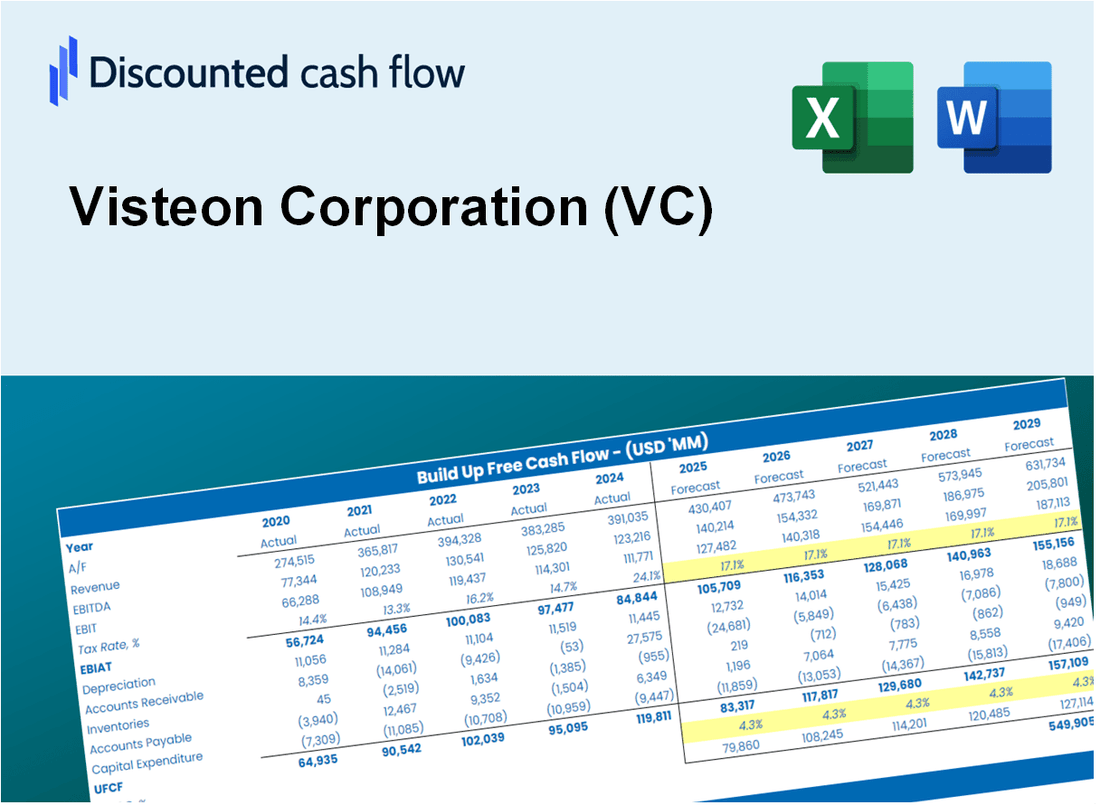
Valoración DCF de Visteon Corporation (VC) |
Completamente Editable: Adáptelo A Sus Necesidades En Excel O Sheets
Diseño Profesional: Plantillas Confiables Y Estándares De La Industria
Predeterminadas Para Un Uso Rápido Y Eficiente
Compatible con MAC / PC, completamente desbloqueado
No Se Necesita Experiencia; Fáciles De Seguir
Visteon Corporation (VC) Bundle
¿Busca evaluar el valor intrínseco de Visteon Corporation? Nuestra calculadora DCF (VC) fusiona datos del mundo real con extensas características de personalización, lo que le permite refinar sus pronósticos y mejorar sus estrategias de inversión.
Discounted Cash Flow (DCF) - (USD MM)
| Year | AY1 2020 |
AY2 2021 |
AY3 2022 |
AY4 2023 |
AY5 2024 |
FY1 2025 |
FY2 2026 |
FY3 2027 |
FY4 2028 |
FY5 2029 |
|---|---|---|---|---|---|---|---|---|---|---|
| Revenue | 2,548.0 | 2,773.0 | 3,756.0 | 3,954.0 | 3,866.0 | 4,323.4 | 4,834.9 | 5,407.0 | 6,046.7 | 6,762.1 |
| Revenue Growth, % | 0 | 8.83 | 35.45 | 5.27 | -2.23 | 11.83 | 11.83 | 11.83 | 11.83 | 11.83 |
| EBITDA | 101.0 | 199.0 | 297.0 | 378.0 | 409.0 | 338.8 | 378.9 | 423.8 | 473.9 | 530.0 |
| EBITDA, % | 3.96 | 7.18 | 7.91 | 9.56 | 10.58 | 7.84 | 7.84 | 7.84 | 7.84 | 7.84 |
| Depreciation | 104.0 | 108.0 | 108.0 | 104.0 | 95.0 | 137.8 | 154.1 | 172.4 | 192.8 | 215.6 |
| Depreciation, % | 4.08 | 3.89 | 2.88 | 2.63 | 2.46 | 3.19 | 3.19 | 3.19 | 3.19 | 3.19 |
| EBIT | -3.0 | 91.0 | 189.0 | 274.0 | 314.0 | 201.0 | 224.8 | 251.4 | 281.1 | 314.4 |
| EBIT, % | -0.11774 | 3.28 | 5.03 | 6.93 | 8.12 | 4.65 | 4.65 | 4.65 | 4.65 | 4.65 |
| Total Cash | 496.0 | 452.0 | 520.0 | 515.0 | 623.0 | 680.9 | 761.5 | 851.6 | 952.4 | 1,065.0 |
| Total Cash, percent | .0 | .0 | .0 | .0 | .0 | .0 | .0 | .0 | .0 | .0 |
| Account Receivables | 499.0 | 552.0 | 672.0 | 736.0 | 638.0 | 799.8 | 894.4 | 1,000.3 | 1,118.6 | 1,251.0 |
| Account Receivables, % | 19.58 | 19.91 | 17.89 | 18.61 | 16.5 | 18.5 | 18.5 | 18.5 | 18.5 | 18.5 |
| Inventories | 177.0 | 262.0 | 348.0 | 298.0 | 283.0 | 350.3 | 391.8 | 438.1 | 490.0 | 548.0 |
| Inventories, % | 6.95 | 9.45 | 9.27 | 7.54 | 7.32 | 8.1 | 8.1 | 8.1 | 8.1 | 8.1 |
| Accounts Payable | 500.0 | 522.0 | 657.0 | 551.0 | 505.0 | 717.1 | 802.0 | 896.9 | 1,003.0 | 1,121.7 |
| Accounts Payable, % | 19.62 | 18.82 | 17.49 | 13.94 | 13.06 | 16.59 | 16.59 | 16.59 | 16.59 | 16.59 |
| Capital Expenditure | -104.0 | -70.0 | -81.0 | -125.0 | -137.0 | -133.7 | -149.6 | -167.3 | -187.1 | -209.2 |
| Capital Expenditure, % | -4.08 | -2.52 | -2.16 | -3.16 | -3.54 | -3.09 | -3.09 | -3.09 | -3.09 | -3.09 |
| Tax Rate, % | 8.05 | 8.05 | 8.05 | 8.05 | 8.05 | 8.05 | 8.05 | 8.05 | 8.05 | 8.05 |
| EBITAT | -8.4 | 46.1 | 133.9 | 518.1 | 288.7 | 166.2 | 185.9 | 207.9 | 232.5 | 260.0 |
| Depreciation | ||||||||||
| Changes in Account Receivables | ||||||||||
| Changes in Inventories | ||||||||||
| Changes in Accounts Payable | ||||||||||
| Capital Expenditure | ||||||||||
| UFCF | -184.4 | -31.9 | 89.9 | 377.1 | 313.7 | 153.3 | 139.2 | 155.7 | 174.1 | 194.7 |
| WACC, % | 8.46 | 8.23 | 8.32 | 8.46 | 8.42 | 8.38 | 8.38 | 8.38 | 8.38 | 8.38 |
| PV UFCF | ||||||||||
| SUM PV UFCF | 638.6 | |||||||||
| Long Term Growth Rate, % | 3.00 | |||||||||
| Free cash flow (T + 1) | 201 | |||||||||
| Terminal Value | 3,727 | |||||||||
| Present Terminal Value | 2,492 | |||||||||
| Enterprise Value | 3,131 | |||||||||
| Net Debt | -197 | |||||||||
| Equity Value | 3,328 | |||||||||
| Diluted Shares Outstanding, MM | 28 | |||||||||
| Equity Value Per Share | 119.27 |
What You Will Get
- Real Visteon Financials: Access to historical and projected data for precise valuation.
- Customizable Inputs: Adjust WACC, tax rates, revenue growth, and capital expenditures as needed.
- Dynamic Calculations: Intrinsic value and NPV are computed automatically.
- Scenario Analysis: Evaluate various scenarios to assess Visteon’s future performance.
- User-Friendly Design: Designed for professionals while remaining easy to use for newcomers.
Key Features
- Comprehensive Visteon Data: Pre-loaded with Visteon Corporation's historical performance and future projections.
- Customizable Variables: Tailor inputs such as revenue growth, profit margins, discount rates, tax rates, and capital expenditures.
- Interactive Valuation Tool: Automatic recalculations of Net Present Value (NPV) and intrinsic value based on your specified parameters.
- Scenario Analysis: Develop various forecasting scenarios to evaluate different valuation possibilities.
- User-Centric Interface: Intuitive design that caters to both seasoned professionals and newcomers.
How It Works
- Download: Obtain the pre-configured Excel file featuring Visteon Corporation's (VC) financial data.
- Customize: Modify projections such as revenue growth, EBITDA %, and WACC as needed.
- Update Automatically: Watch as intrinsic value and NPV calculations refresh in real-time.
- Test Scenarios: Generate various forecasts and instantly analyze different outcomes.
- Make Decisions: Leverage the valuation insights to inform your investment strategy.
Why Choose Visteon Corporation (VC)?
- Innovative Solutions: Cutting-edge technology for advanced automotive systems.
- Global Expertise: A worldwide presence ensures comprehensive support and insights.
- Commitment to Sustainability: Focused on environmentally friendly practices and products.
- Customer-Centric Approach: Tailored solutions to meet the unique needs of our clients.
- Industry Leadership: Recognized for excellence and reliability in the automotive sector.
Who Should Use This Product?
- Investors: Accurately assess Visteon Corporation’s (VC) fair value prior to making investment choices.
- CFOs: Utilize a robust DCF model for financial reporting and strategic analysis related to Visteon Corporation (VC).
- Consultants: Easily modify the template for valuation reports tailored to clients focused on Visteon Corporation (VC).
- Entrepreneurs: Acquire knowledge on financial modeling practices employed by industry leaders like Visteon Corporation (VC).
- Educators: Implement it as a teaching resource to illustrate valuation techniques applicable to Visteon Corporation (VC).
What the Template Contains
- Pre-Filled DCF Model: Visteon Corporation’s (VC) financial data preloaded for immediate use.
- WACC Calculator: Detailed calculations for Weighted Average Cost of Capital.
- Financial Ratios: Evaluate Visteon’s (VC) profitability, leverage, and efficiency.
- Editable Inputs: Change assumptions such as growth, margins, and CAPEX to fit your scenarios.
- Financial Statements: Annual and quarterly reports to support detailed analysis.
- Interactive Dashboard: Easily visualize key valuation metrics and results.
Disclaimer
All information, articles, and product details provided on this website are for general informational and educational purposes only. We do not claim any ownership over, nor do we intend to infringe upon, any trademarks, copyrights, logos, brand names, or other intellectual property mentioned or depicted on this site. Such intellectual property remains the property of its respective owners, and any references here are made solely for identification or informational purposes, without implying any affiliation, endorsement, or partnership.
We make no representations or warranties, express or implied, regarding the accuracy, completeness, or suitability of any content or products presented. Nothing on this website should be construed as legal, tax, investment, financial, medical, or other professional advice. In addition, no part of this site—including articles or product references—constitutes a solicitation, recommendation, endorsement, advertisement, or offer to buy or sell any securities, franchises, or other financial instruments, particularly in jurisdictions where such activity would be unlawful.
All content is of a general nature and may not address the specific circumstances of any individual or entity. It is not a substitute for professional advice or services. Any actions you take based on the information provided here are strictly at your own risk. You accept full responsibility for any decisions or outcomes arising from your use of this website and agree to release us from any liability in connection with your use of, or reliance upon, the content or products found herein.